
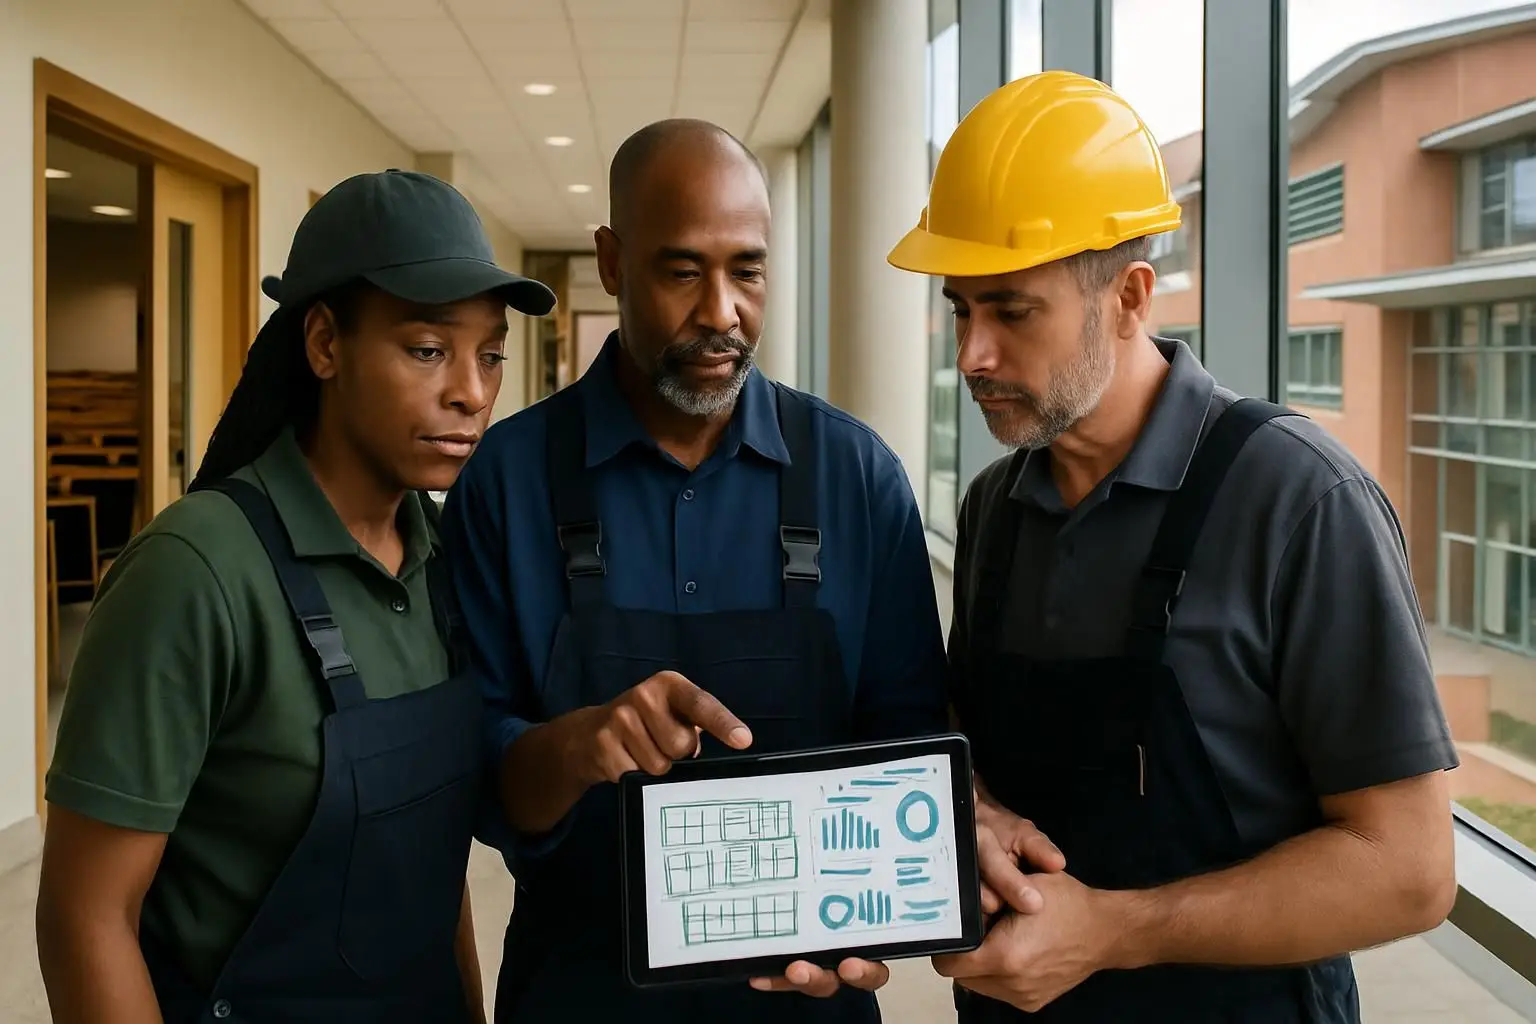
Universities cannot build reliable space-planning KPIs from maintenance records alone—but structured maintenance, inspection, and work-order data gives campus teams an essential operational layer. When this data is consistently tied to buildings, floors, rooms, assets, dates, and issue types, it reveals how spaces perform, where service demand concentrates, and which areas may warrant closer utilization, condition, or investment review.
Key takeaways
- Facility-management data does not measure occupancy or classroom utilization directly; it provides operational context for those measures.
- Consistent location, asset, work-order, inspection, and downtime records are essential for reliable analysis.
- Combine operational data with timetabling, access, booking, and occupancy data before making portfolio decisions.
The space-planning challenge is also an operational-data challenge
University estates are complex. A single portfolio can include teaching buildings, lecture theatres, laboratories, libraries, sports facilities, residences, administrative offices, research areas, and specialist spaces. Each has different patterns of demand, risk, maintenance needs, operating hours, and constraints.
Space planning often starts with sensible questions: Do we have enough teaching space? Which rooms are underused? Should an ageing building be renovated, repurposed, or retired? Are student-facing facilities supporting the campus experience?
Yet answering those questions requires more than a room inventory or timetable. It requires reliable definitions, consistent data capture, and enough operational context to distinguish an apparently unused room from a room that is unavailable, unsuitable, under repair, poorly configured, or simply not visible in the right system.
According to JLL’s 2025 Higher-Education Portfolio Benchmark, which analyzed 173 million square feet across 12 institutions, 81% of institutions lacked foundational space-management KPIs and planned versus actual classroom utilization differed by 33 percentage points.
That finding should not be interpreted to mean maintenance data can calculate actual utilization. It cannot. A closed work order does not prove a room was occupied, and a low fault count does not prove a space was empty.
Instead, facility management solutions help universities establish the operational data discipline needed to make space data more credible and more actionable.
What facility management data can—and cannot—tell space planners
The most useful approach is to be explicit about the role of every data source. Operational data explains the condition, availability, and service burden of space. Utilization data explains whether and how much space is used. Together, they support better decisions.
| Data source | What it can indicate | What it cannot prove on its own | Typical owner |
|---|---|---|---|
| Work orders and fault reports | Recurring issues, response demand, affected locations, outage patterns | Headcount, dwell time, scheduled use | Facilities / estates |
| Inspections and condition checks | Compliance status, visible defects, condition trends, readiness | Actual occupancy or teaching intensity | Facilities / estates |
| Preventive maintenance records | Asset servicing history, planned downtime, maintenance burden | Whether a room is booked or attended | Facilities / estates |
| Timetabling data | Planned teaching allocation and booked room time | Whether classes took place or rooms were fully attended | Academic scheduling |
| Booking and access data | Reservations, entry events, patterns of availability | Full room occupancy or quality of user experience | Workplace, security, scheduling |
| Occupancy sensors or observation studies | Actual presence and occupancy at selected times | Root causes of poor room condition or service disruption | Space planning / estates |
This distinction prevents a common analytical error: using a convenient operational metric as a proxy for utilization. A seminar room with few reported faults may be unused, exceptionally well maintained, underreported, or used by people who lack an easy reporting channel. The interpretation changes when teams can compare fault history with room bookings, access patterns, inspection results, and known closures.
The Campus Space Evidence Model
A practical university data strategy can be organized around four connected evidence layers: Place, Performance, Availability, and Demand. This Campus Space Evidence Model gives planners a clearer way to connect day-to-day facility activity with portfolio decisions without overstating what any dataset means.
1. Place: establish a common location hierarchy
Every operational record should point to a consistent campus location. At minimum, teams need a hierarchy such as campus, building, floor, room, and space type. Where relevant, the record should also identify the asset involved, such as an air-handling unit, projector, door, laboratory safety shower, or washroom fixture.
Without this structure, a report saying “air conditioning issue in Block A” may be useful for dispatch but weak for analysis. It cannot reliably be joined to room capacity, space category, academic timetable, refurbishment plans, or building condition information.
A useful location taxonomy should be governed centrally but practical for frontline users. Room naming must match, or be mappable to, the identifiers used in timetabling and space registers. Changes such as building renames, room subdivisions, and temporary decant spaces should be documented rather than left to informal local knowledge.
2. Performance: capture the service experience of each space
Work orders, faults, inspections, and preventive maintenance generate a record of how a campus environment performs. The point is not to judge a space solely by the number of tickets it produces. A busy laboratory may naturally generate more requests than a lightly used office. Instead, planners should look at demand in context.
Useful performance measures include:
- Work orders per room, building, or space category over a defined period
- Repeat faults by issue category, asset, and location
- Time to acknowledge, attend, and close requests
- Preventive maintenance completion rates for assets serving priority spaces
- Inspection exceptions and overdue corrective actions
- Incident-related downtime or periods when a room was unavailable
- Backlog patterns by campus, building age, or criticality
These measures create a richer picture of operational friction. For example, a cluster of recurring audiovisual, thermal-comfort, lighting, or access-control issues in teaching rooms may help explain why a space is avoided, rescheduled, or perceived as unsuitable. The maintenance system does not establish the final reason for low use, but it identifies questions worth investigating.
3. Availability: record when space cannot perform its intended role
Availability is the bridge between maintenance operations and space planning. A timetable may show a room as available, while facilities records show that it was partially inaccessible, unsafe, too hot, awaiting repair, or taken offline for planned work.
Universities should define a consistent method for recording disruptions. Not every minor defect needs to be treated as a room closure. However, teams should be able to distinguish between a low-impact issue and one that affects the room’s ability to support teaching, research, residence life, or public access.
| Availability event | Example | Space-planning relevance |
|---|---|---|
| Full closure | Flood damage closes a lecture theatre | Removes capacity from the usable portfolio |
| Partial loss of function | Failed projector in a teaching room | May make the room unsuitable for scheduled delivery |
| Safety restriction | Laboratory equipment or ventilation issue | Can limit permitted activities, reduce usable capacity, and require temporary relocation. Record the restriction, affected rooms, start and end dates, and severity. |
| Planned maintenance window | HVAC shutdown during a semester break | Supports scheduling and lifecycle coordination |
| Persistent comfort issue | Repeated temperature complaints | Signals a possible quality or suitability problem |
Capturing these distinctions helps avoid treating all nominally available square footage as equally usable space.
4. Demand: connect operations to utilization evidence
Demand data is where planners assess planned allocation and actual use. Timetables, room-booking systems, access data, sensor data, and periodic observational studies all have a role. Each carries its own coverage, privacy, accuracy, and governance considerations.
The value of operational data is its ability to add explanatory context. If actual classroom utilization is below the planned figure, teams can investigate whether the gap is associated with room type, time of day, technology issues, closures, comfort complaints, booking behavior, or scheduling practices.
This is a better question than, “Which dataset is right?” In most cases, the goal is to reconcile evidence—not force one system to answer every question.
Start with KPI definitions before building dashboards
A dashboard cannot fix inconsistent inputs. Before choosing charts or targets, estates, space planning, scheduling, IT, and finance stakeholders should agree on a small KPI dictionary.
For every measure, document the definition, calculation, owner, source systems, update frequency, exclusions, and intended decision. For example, “classroom utilization” needs a clear numerator and denominator. Does it refer to scheduled hours, observed occupied hours, seats filled, or another measure? Are rooms under renovation excluded? Are hybrid classes counted differently?
The same discipline applies to operational KPIs. “Repeat fault” might mean the same issue category in the same room within 30 days, or it might mean repeat failure of a specific asset. Either definition can be valid; what matters is using it consistently.
| KPI | Practical definition | Why it supports space planning |
|---|---|---|
| Room operational availability | Percentage of planned operating time when a room is fit for intended use, excluding agreed exceptions | Adds an operational reality check to nominal capacity |
| Repeat issue rate | Share of faults that recur in the same location, category, or asset within a defined period | Identifies spaces or systems creating disproportionate friction |
| Corrective maintenance burden | Work-order volume and effort associated with a room type or building | Helps compare lifecycle and service implications of retained space |
| Planned versus actual utilization | Comparison of scheduled use against a defined actual-use source | Highlights allocation, attendance, or suitability questions |
| Condition exception rate | Share of inspections with unresolved exceptions | Indicates where space quality may constrain effective use |
Avoid prematurely ranking buildings as “good” or “bad” from one KPI. A building with high ticket volume may be highly used, have an excellent reporting culture, or contain specialist environments requiring close support. Pair volume metrics with severity, downtime, space type, and demand information.
How software for facility management improves the data foundation
The quality of campus KPIs is shaped by small choices in frontline workflows. If users report issues through unstructured emails, phone calls, or informal messages, facilities teams may still resolve problems effectively—but the data is hard to classify, locate, compare, and reuse.
Software for facility management brings structure to those workflows. A mobile or messaging-based fault-reporting process can guide users to select a location, describe the issue, attach a photo when appropriate, and create a timestamped request. Technicians can then assign categories, record actions, update status, and close the work order against the relevant location or asset.
Digitised inspections and preventive maintenance work in a similar way. They make checklists, missed tasks, exceptions, corrective actions, and servicing histories more traceable. Over time, this creates a consistent operational history that a university can analyze by campus, building, floor, room type, or asset class.
For education estates, ease of reporting matters. Students, lecturers, administrators, and contracted staff should not need extensive system training to report a problem affecting a room. A messaging-first tool such as FacilityBot can support simple reporting through familiar channels while routing requests into structured work-order records. Its multi-campus configuration can also help estates teams maintain a shared operating model while preserving location-level accountability.
An integrated workplace management system may provide broader capabilities across real estate, capital projects, lease administration, space management, and workplace services. A CMMS or focused facilities platform may be the right operational foundation when the immediate need is stronger maintenance, inspection, asset, and work-order data. The best choice depends on the university’s existing systems, governance capacity, and implementation priorities.
| Need | Often best addressed by | Key integration consideration |
|---|---|---|
| Standardize fault reporting, inspections, preventive maintenance, and work orders | CMMS or facilities management platform | Use common building and room identifiers |
| Manage detailed space inventory, allocation, and utilization analysis | Space-management platform or integrated workplace management system | Align room taxonomy and capacity fields |
| Plan class schedules and teaching allocation | Timetabling system | Exchange room IDs, availability, and closure data |
| Analyze portfolio costs and capital scenarios | ERP, finance, or portfolio-planning tools | Map costs to buildings and space categories |
A phased route to better campus space planning
Universities do not need to wait for a perfect enterprise data program before improving. A phased approach delivers useful insight while reducing data-quality risk.
Phase 1: make daily records location-aware
Prioritize the highest-value campus locations: general teaching rooms, major lecture theatres, laboratories, libraries, student residences, and critical plant areas. Standardize room identifiers, issue categories, priority definitions, and closure statuses. Train teams on the few fields that matter most.
Phase 2: establish a baseline and investigate exceptions
Review six to twelve months of work orders, inspections, preventive maintenance, and downtime where records exist. Look for concentrated repeat issues, unavailable rooms, inspection failures, and response bottlenecks. Validate findings with local facilities managers and academic users before drawing conclusions.
Phase 3: join operational and demand data
Connect facilities records to the space register, timetable, booking data, and selected actual-use sources. Start with a limited pilot—perhaps one campus or a set of high-demand teaching buildings. This makes data mismatches visible and lets teams refine definitions before enterprise rollout.
Phase 4: use evidence in governance decisions
Bring the combined view to regular portfolio, capital-planning, and space-governance meetings. Use it to prioritize investigations, coordinate maintenance windows, assess room suitability, and test options for refurbishment or repurposing. Keep human review in the process; KPIs should inform decisions, not replace operational judgment.
Choosing a platform without buying more than you need
When evaluating facility management solutions, universities should focus on the workflows and integrations that make their KPI strategy viable. A sophisticated platform with poor frontline adoption will produce weak data. Conversely, a simple workflow with clear data standards can create meaningful progress quickly.
Evaluate prospective systems against location hierarchy support, configurable categories, mobile or messaging-based reporting, inspection workflows, preventive maintenance, work-order history, permissions, export capability, and integration options. Also ask how the platform will handle campus expansions, room changes, external contractors, and different stakeholder groups.
Cost should be evaluated against the operational time saved, avoided service disruption, better auditability, and improved confidence in capital and space decisions—not only against licence price. Review FacilityBot pricing alongside your required workflows and rollout scope to build a realistic business case.
FAQ
Can work-order data measure classroom utilization?
No. Work-order data records service demand, faults, repairs, and related operational activity—not attendance or occupancy. It becomes valuable for space planning when combined with timetabling, booking, access, sensor, or observational data because it explains whether availability, condition, or recurring issues may influence how a room is used.
What is the first KPI a university should establish for space planning?
Start with a clearly defined room operational availability KPI for priority spaces, alongside a dependable room inventory. It is practical to build from facilities data and helps distinguish nominal capacity from space that is genuinely fit for intended use. Add planned-versus-actual utilization once reliable demand data and definitions are in place.
Does a university need an integrated workplace management system for space planning?
Not always. An integrated workplace management system can be appropriate for institutions needing broad real-estate and workplace capabilities. Many universities can begin by improving structured maintenance, inspection, work-order, and location data, then integrate those records with their existing timetable and space-management tools.
Better space planning begins with better evidence about how campus space performs every day. Book a FacilityBot demo to explore how structured operational workflows can strengthen your university’s facilities data foundation.
