FacilityBot Analytics enables facility teams to visualize and interpret operational data through customizable charts and dashboards—similar to tools like Power BI, but natively built into FacilityBot for seamless analysis. One of the most versatile visualization types is the Mixed Chart, which combines multiple chart styles (such as bar, line, or area) in a single view. This allows users to compare different metrics, visualize relationships, and highlight trends that a single chart type may not capture effectively.
Mixed Charts are ideal for comparing request volume versus completion trends, energy consumption versus cost, or preventive maintenance frequency versus downtime—providing facility managers with a richer, multi-dimensional perspective of performance.
Configuring an Mixed Chart
To create a Mixed Chart in Analytics:
- Log in to the FacilityBot Manager Portal.
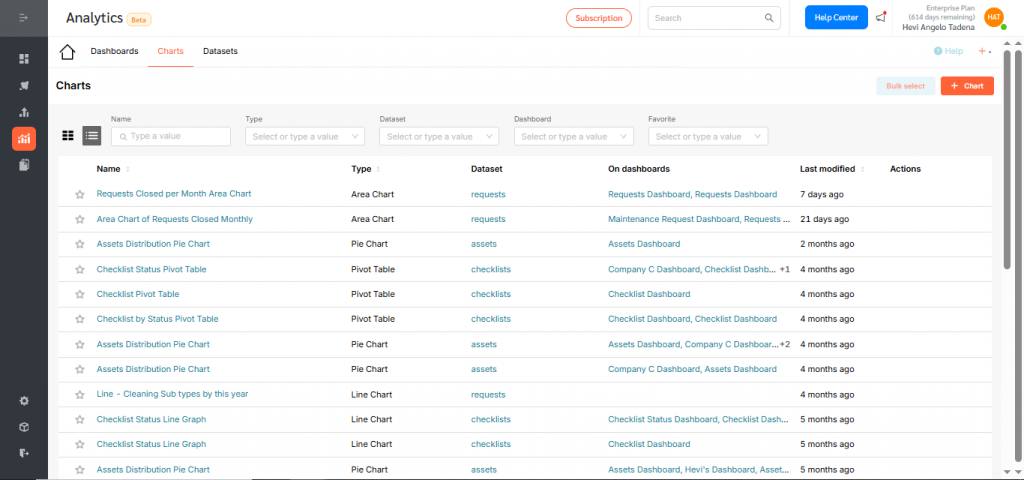
- Navigate to Analytics, Charts, then click the + Chart icon.
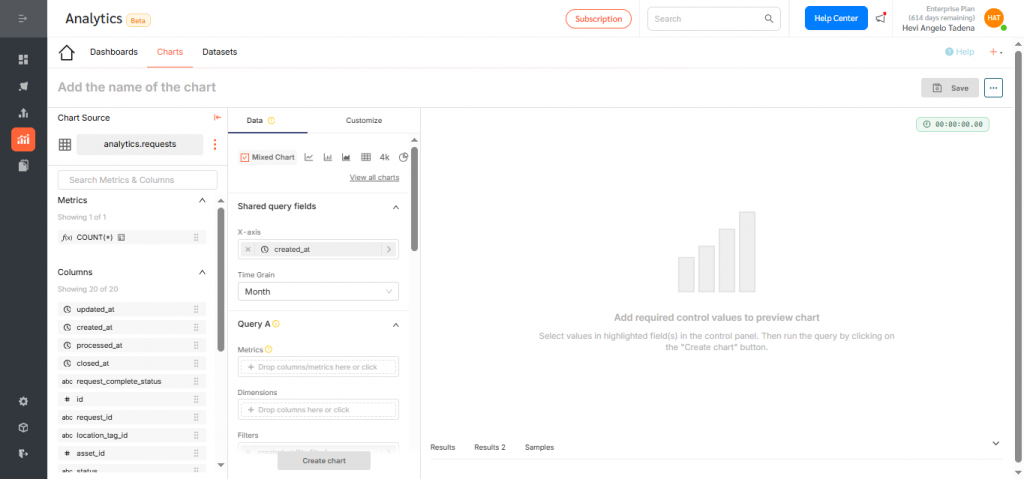
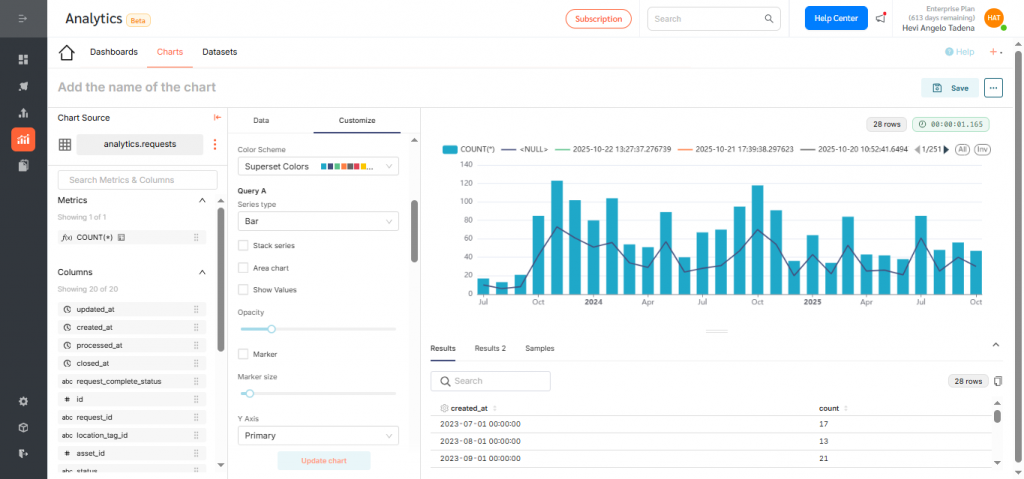
- For this walkthrough, we’ll create a Mixed Chart showing the number of maintenance requests created in a Bar Chart and the number closed in Line Chart per month. Choose your dataset. For this example, select Requests.
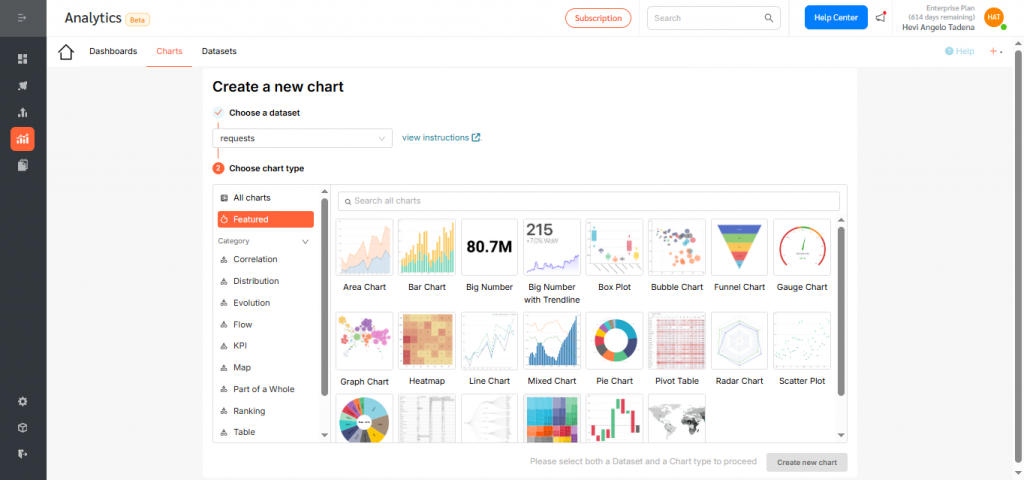
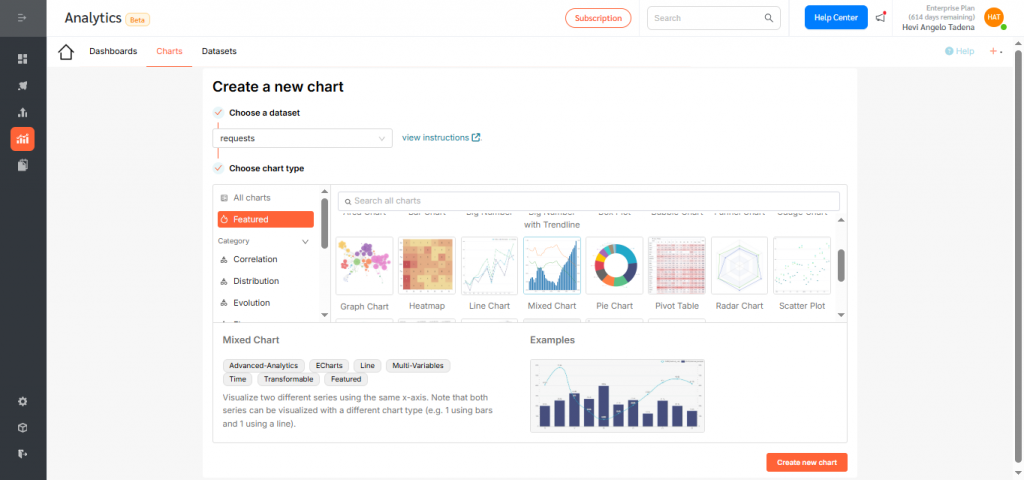
- Click the Mixed Chart icon, then select Create new chart to begin configuration.
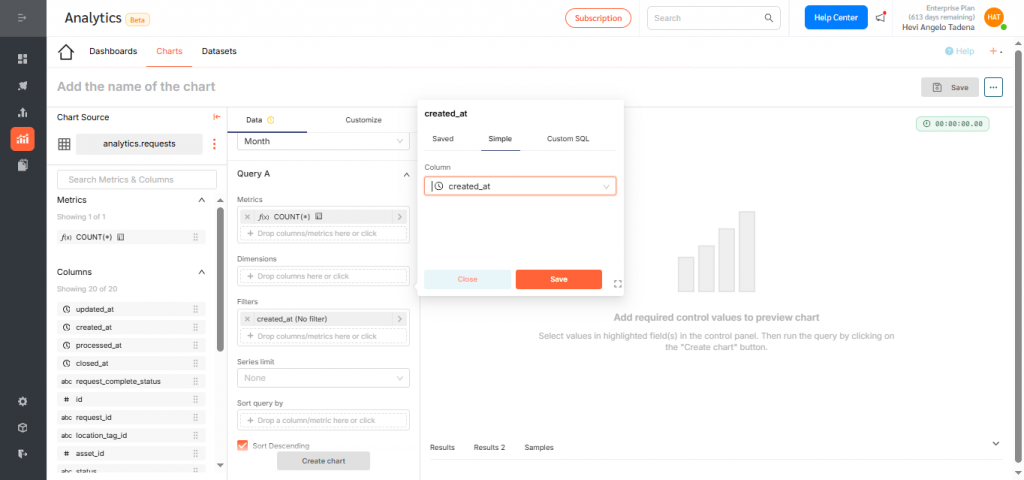
- Under the X-Axis, select the dimension you want to visualize—here, choose created_at to group requests by creation date.Click Save to confirm your selection.
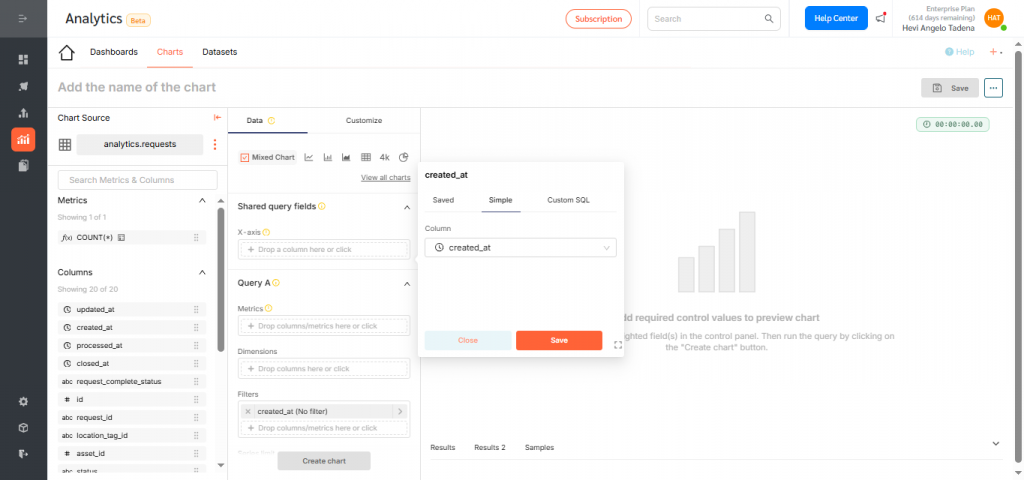
- Adjust the time grain (daily, weekly, monthly, quarterly, or yearly). For this example, select Monthly to show trends over time.
- Add the first metric under Query A—for example, use the count function to display the number of requests created.
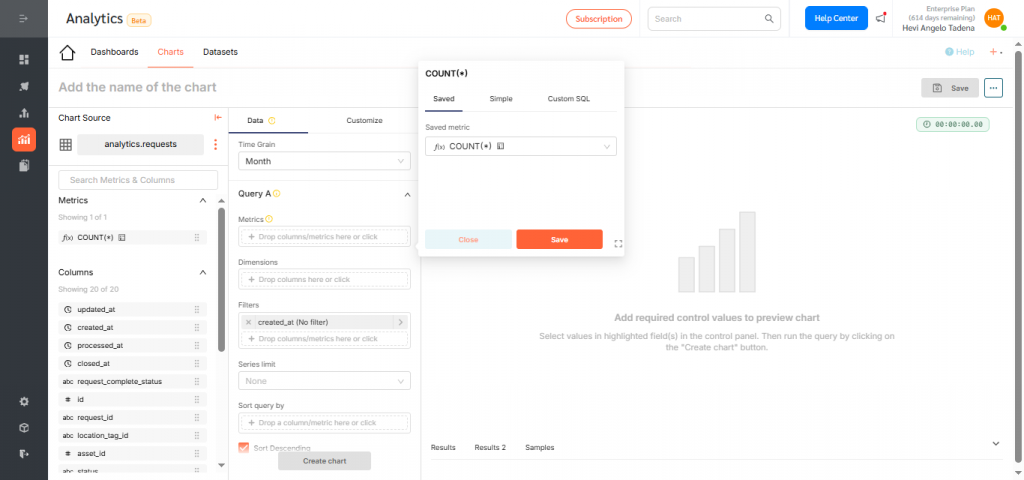
- Then add the dimension which is created at in this case and click save.
- Add a second metric under Query B to overlay. Choose count again and click save.
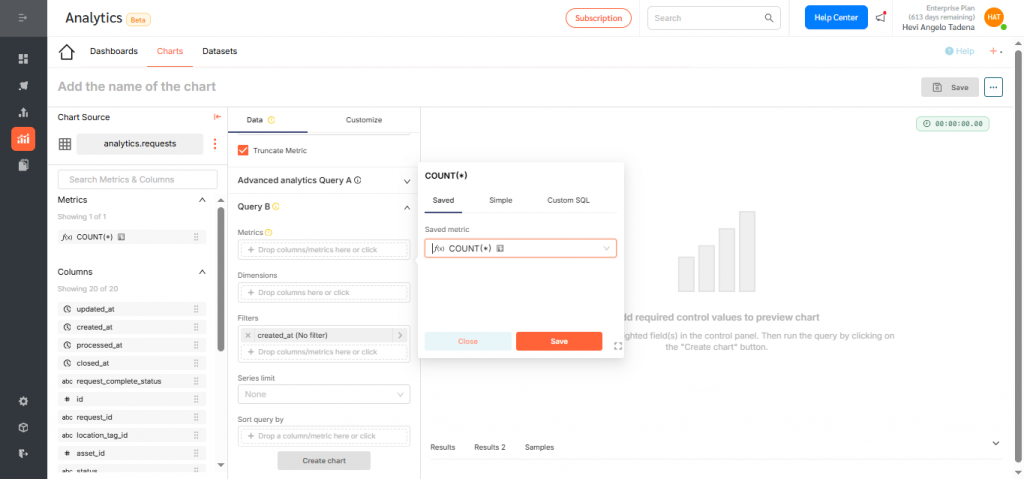
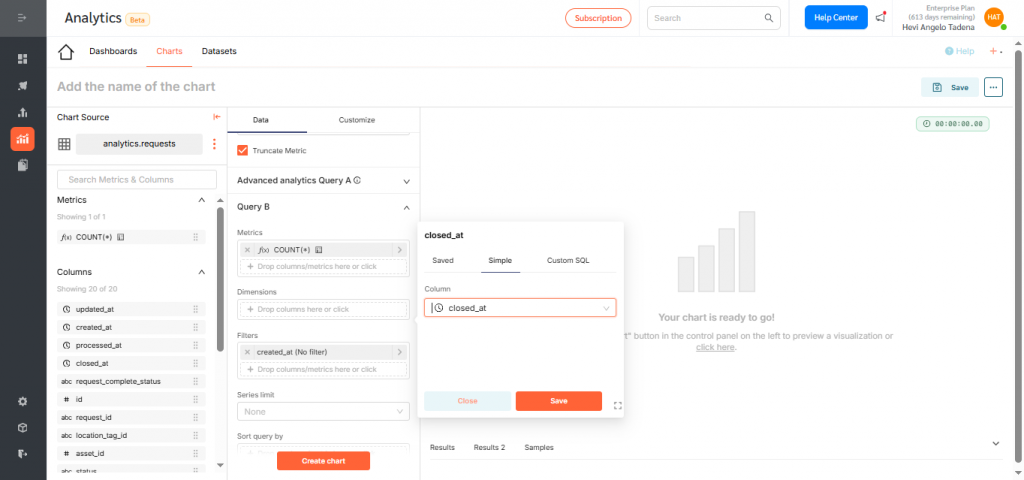
- Now set the dimension to closed_at to show completed requests. Then click save.
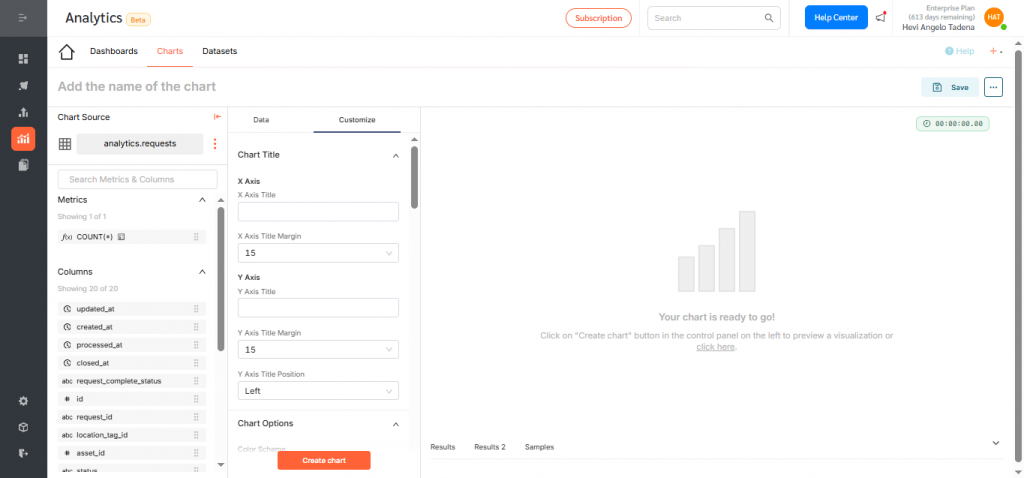
- Now go to Customize tab.
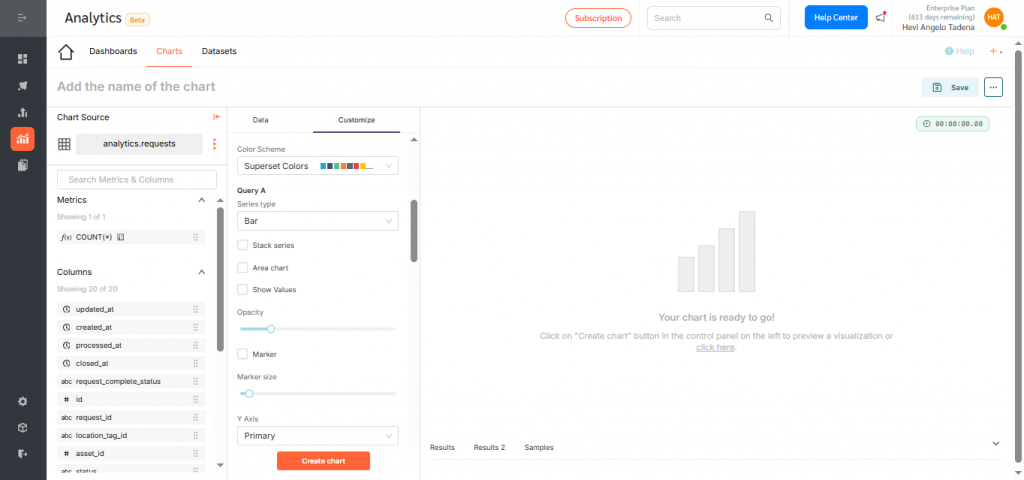
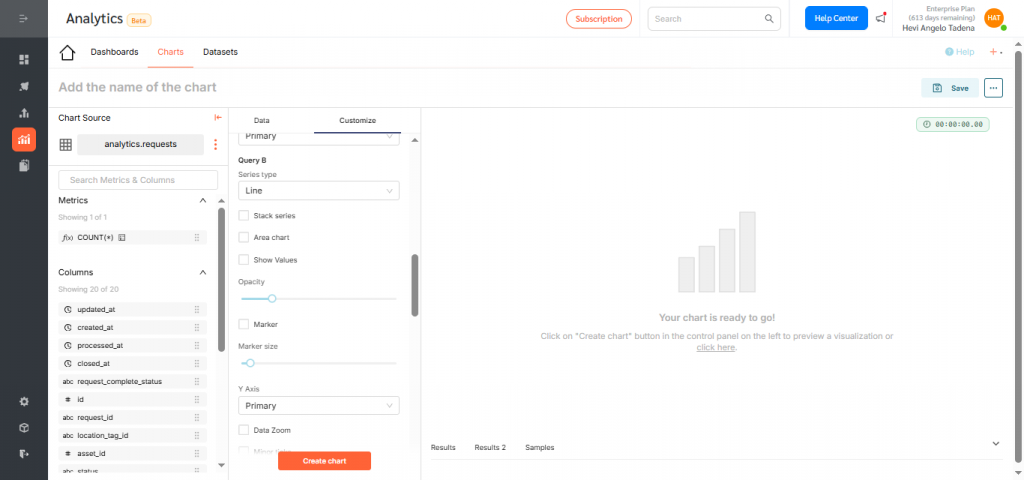
- Assign a different chart type for each series—for example: Bar Chart for Requests Created and Line Chart for Requests Closed. To do this scroll down to Query A and choose Bar as the series type and choose Line for Query B
- Click Create Chart to preview your configuration.

- If everything looks correct, click Save.
- Name your chart descriptively (e.g., “Monthly Request Creation vs Closure Trend”) and assign it to a dashboard for visibility.Click Save again to finalize.
Displaying the Mixed Chart on a Dashboard
To add your chart to a dashboard:
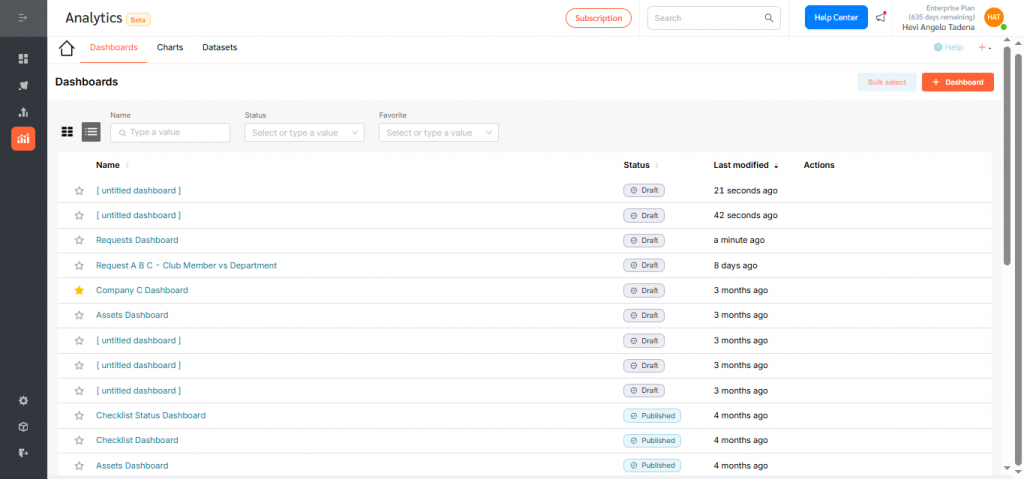
- Go to Dashboards and click +Dashboard.
- Drag your desired chart into the layout.
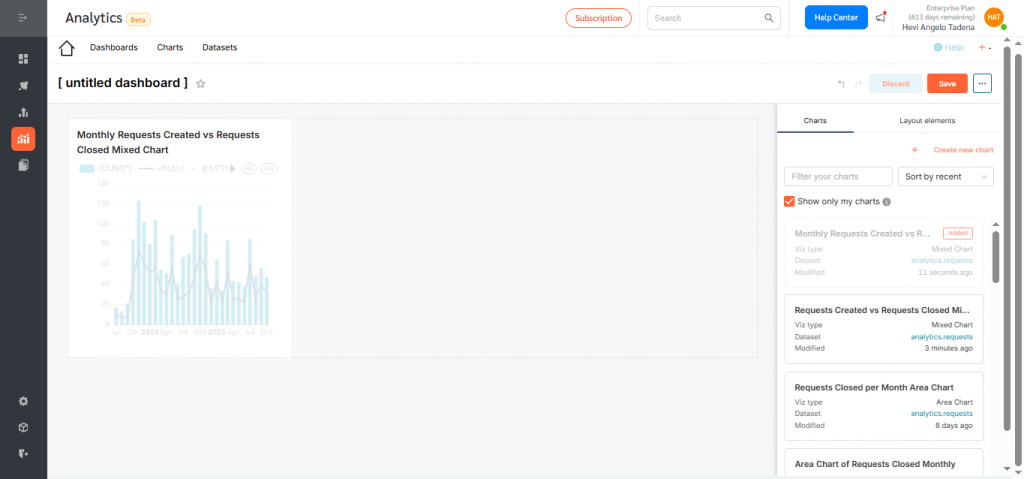
- Resize or reposition as needed.
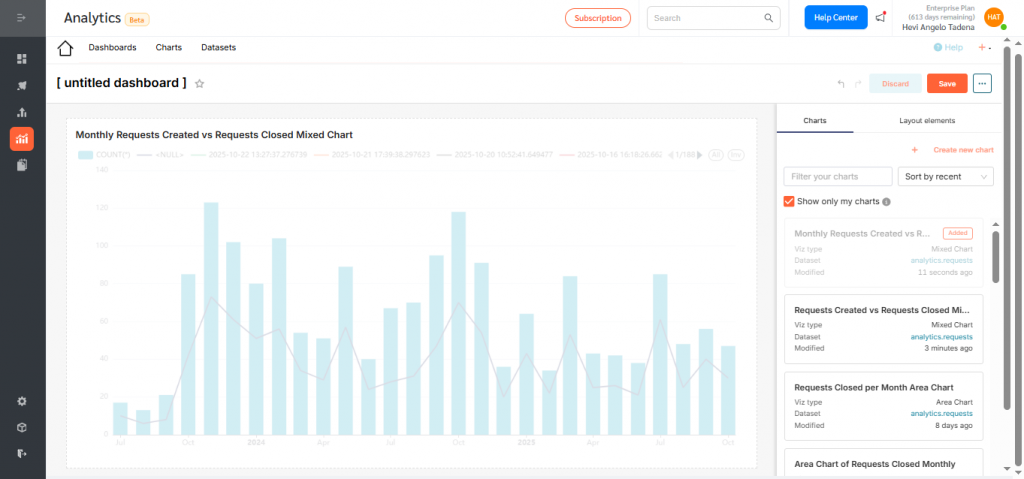
- Rename the dashboard to reflect its purpose and click Save.
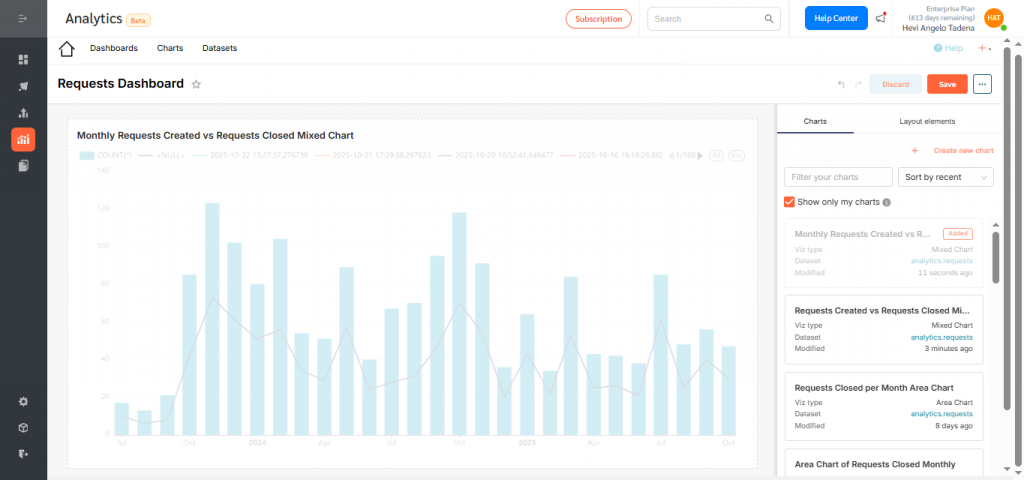
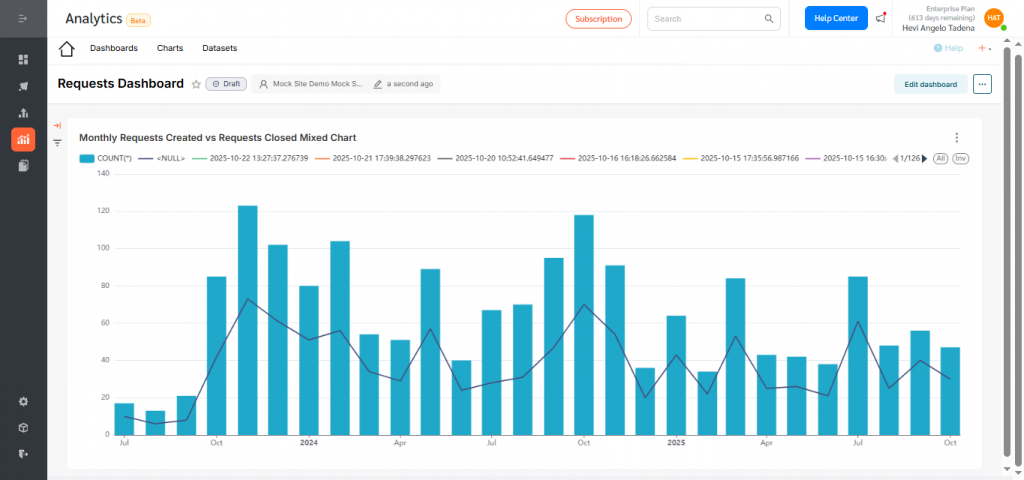
- By default, dashboards are saved as drafts. Click the Draft icon to publish.
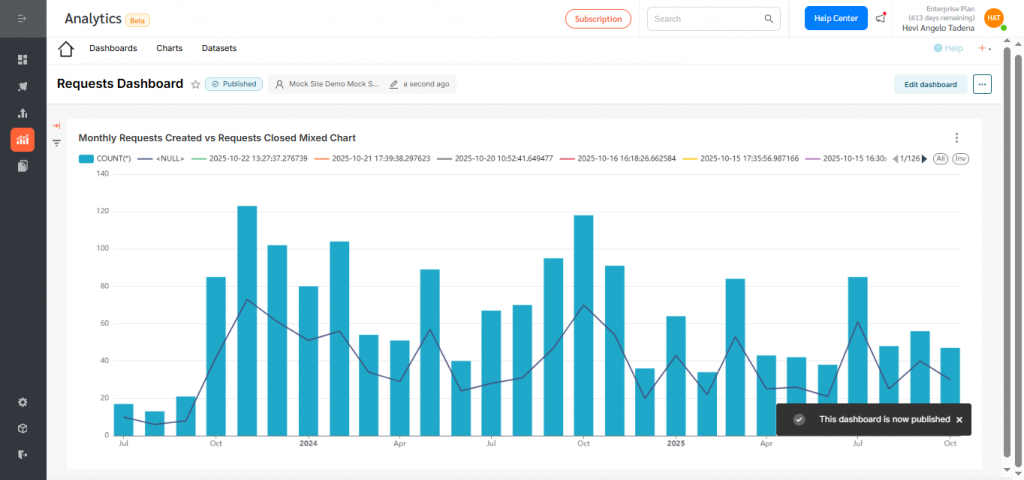
Mixed Charts in FacilityBot Analytics allow facility managers to combine multiple chart types—such as bars, lines, and areas—into a single visualization. This helps compare different datasets or metrics side by side, highlighting relationships and trends more clearly. They are ideal for analyzing performance metrics, maintenance trends, and operational efficiency all in one view for smarter, data-driven decisions.
