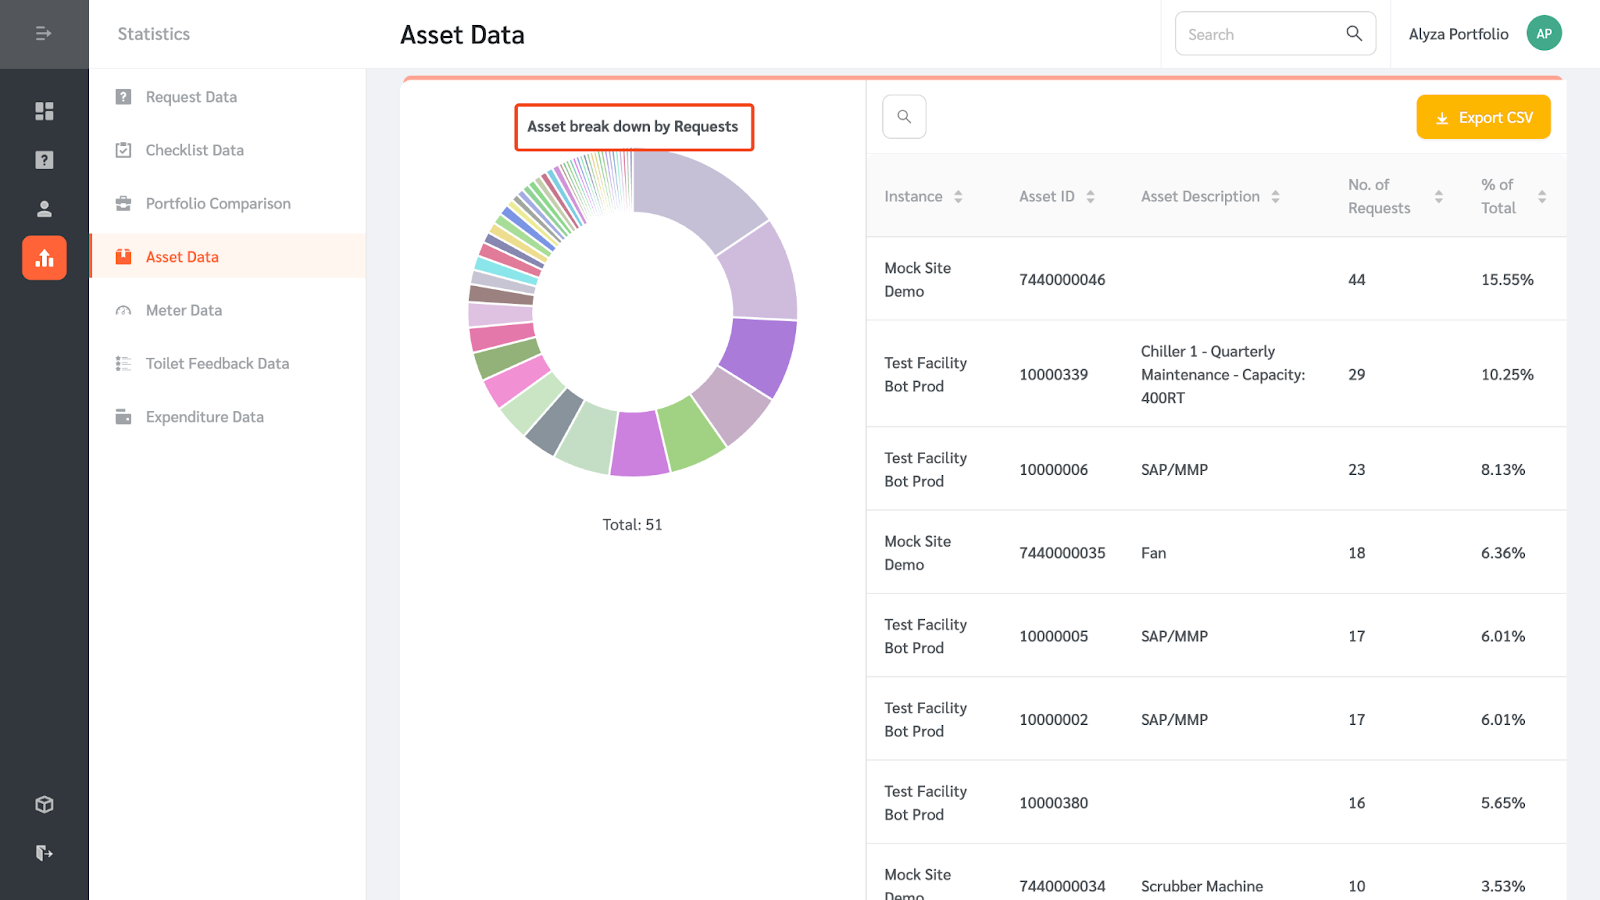
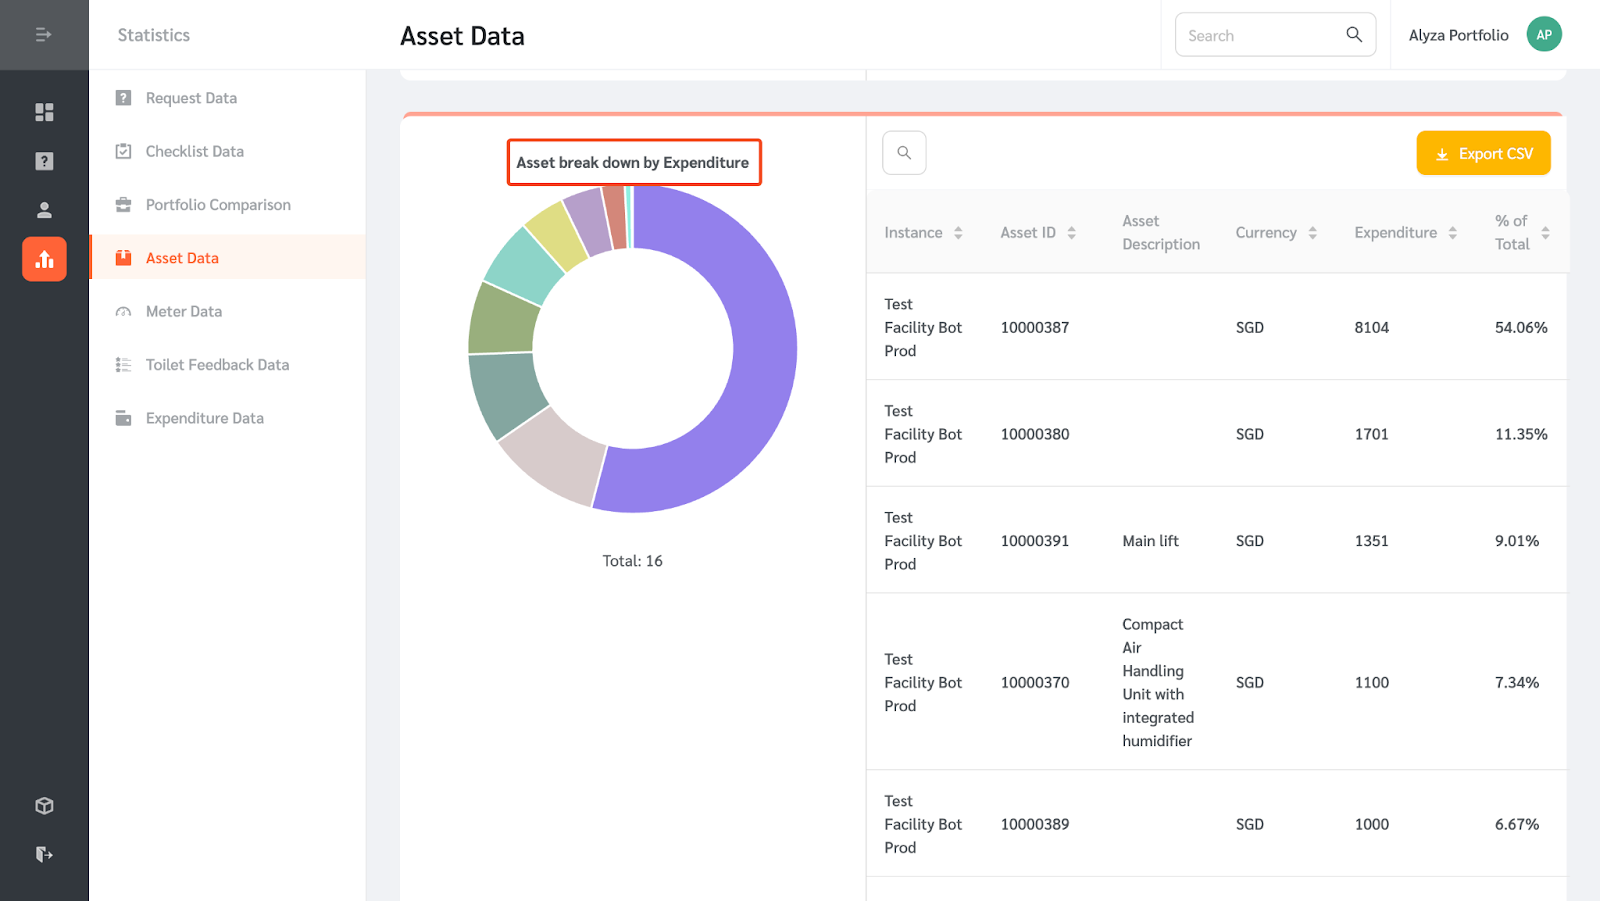
The Asset Data charts and tables aggregate the asset data from the underlying linked instances including the breakdown by requests and breakdown by expenditure.
- Click on Statistics then Asset Data.
- This data can be filtered by Date Range.
- The left side of the page shows a pie chart view of the asset data while the right shows a table view.
- Tables can be exported as a CSV file and added to a custom dashboard using the Plus icon.
- The charts and tables show the asset breakdown by Requests and Expenditures.