The Meter Statistics charts and tables aggregate the Meter data including aggregated and raw data.
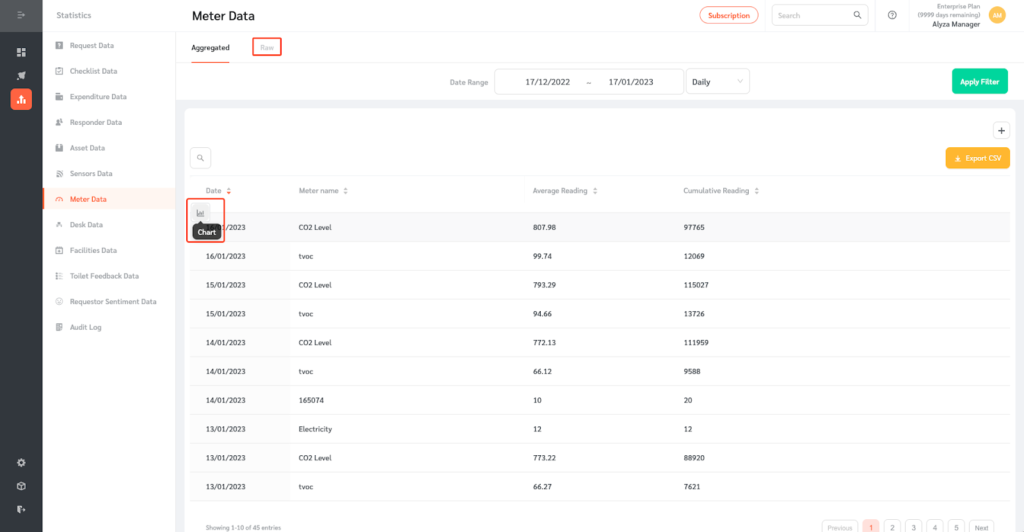
- To access this data, log in to FacilityBot Portal. Click on Statistics then Meter Data.
- This data can be filtered by Date Range.

Aggregated Meter Data
- The aggregated data is broken down by date. Here, you can view the name of the meter and the average reading and cumulative reading.
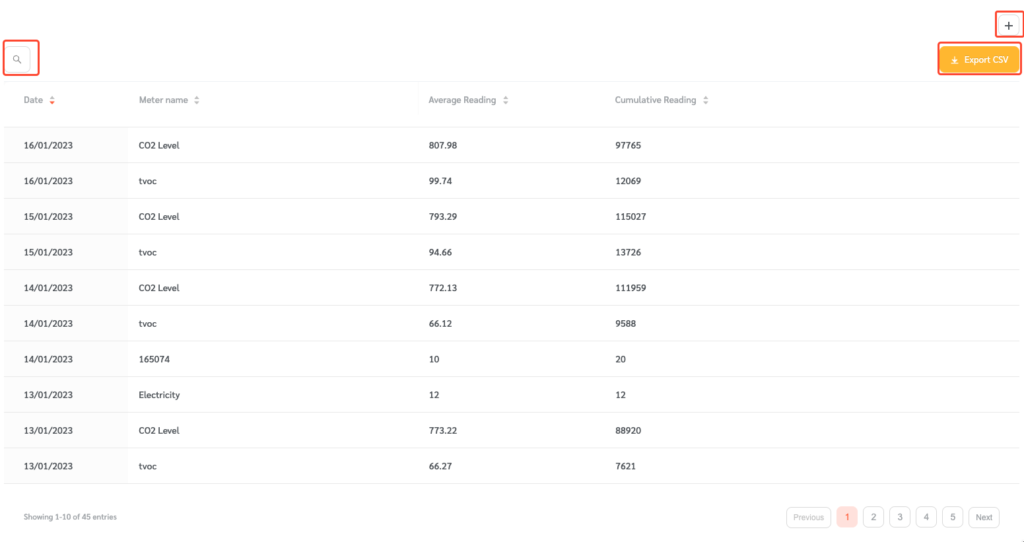
- Use the search field to search for a specific Meter.
- The table can also be exported as a CSV file using the Export CSV button.
- Click on the Plus icon to add the table to a custom dashboard.
Raw Meter Data
- To view the raw data, click on the Raw section on the upper left or hover on a selected sensor and click on the chart icon.
- Here you can view the sensor chart.
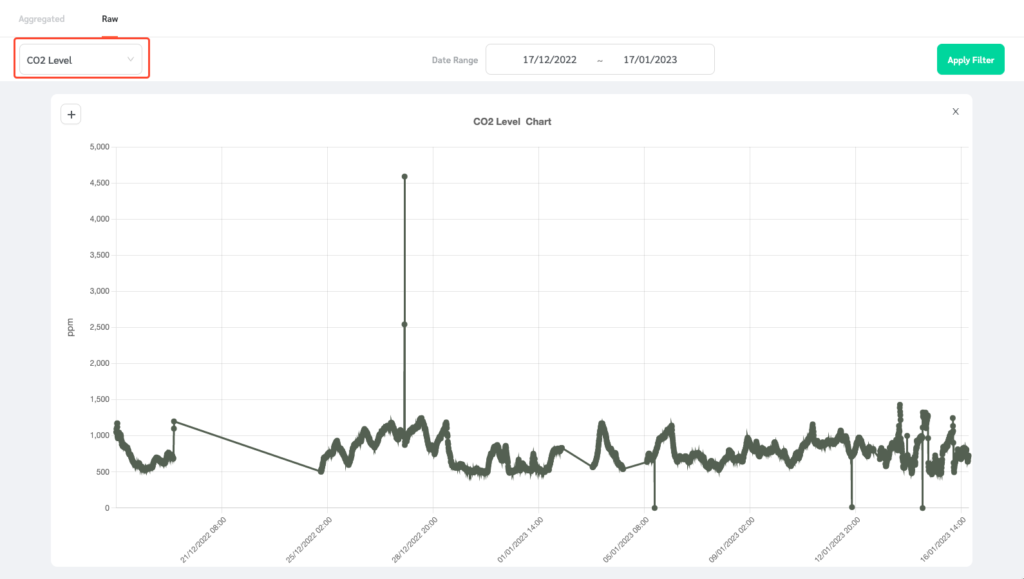
- Choose a sensor on the dropdown to view another sensor chart.
- On the bottom, you can see the raw meter data table. The table shows the breakdown by meter type. Here you can view the reading, unit of measurement, and date of last update.
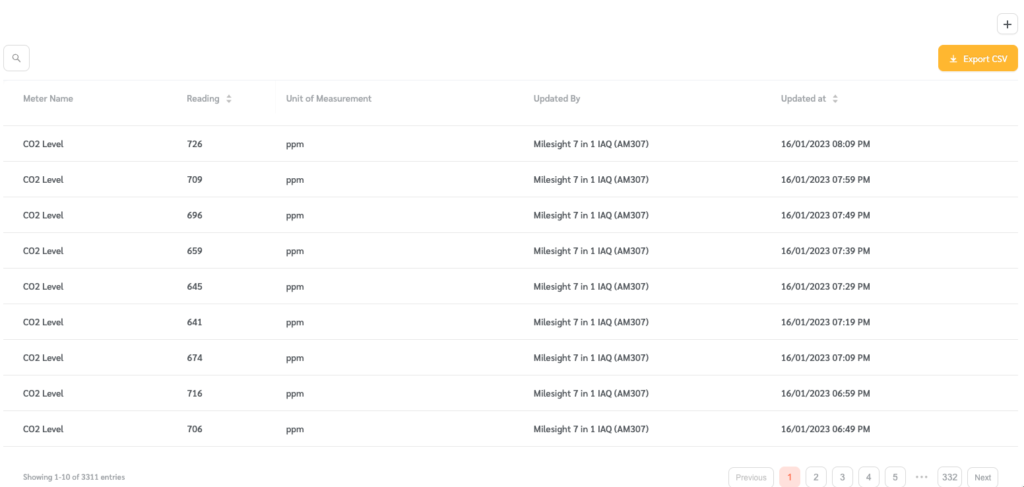
- Similar to the Aggregated Meter Data, you can use the search field to search for a specific Sensor or click on the Plus icon to add the table to a custom dashboard.
