Facility managers and admins may want to see their facility’s energy consumption and corresponding sustainability metrics, including Carbon Emissions, Energy Use Intensity and Energy Cost.
Linking the Meters
- Log in to FacilityBot Web Portal.
- Go to ‘Statistics’ then ‘Sustainability Data.’
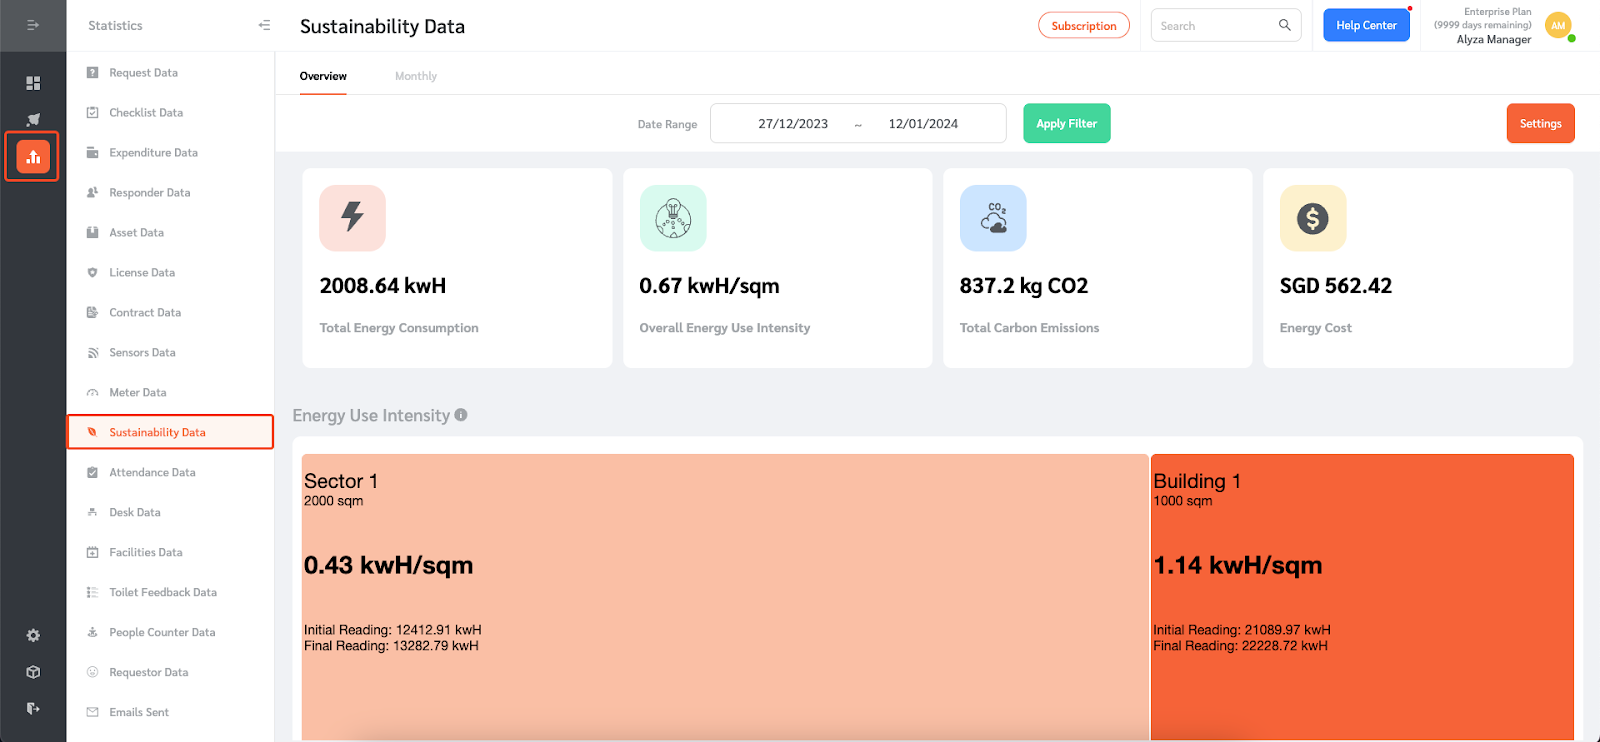
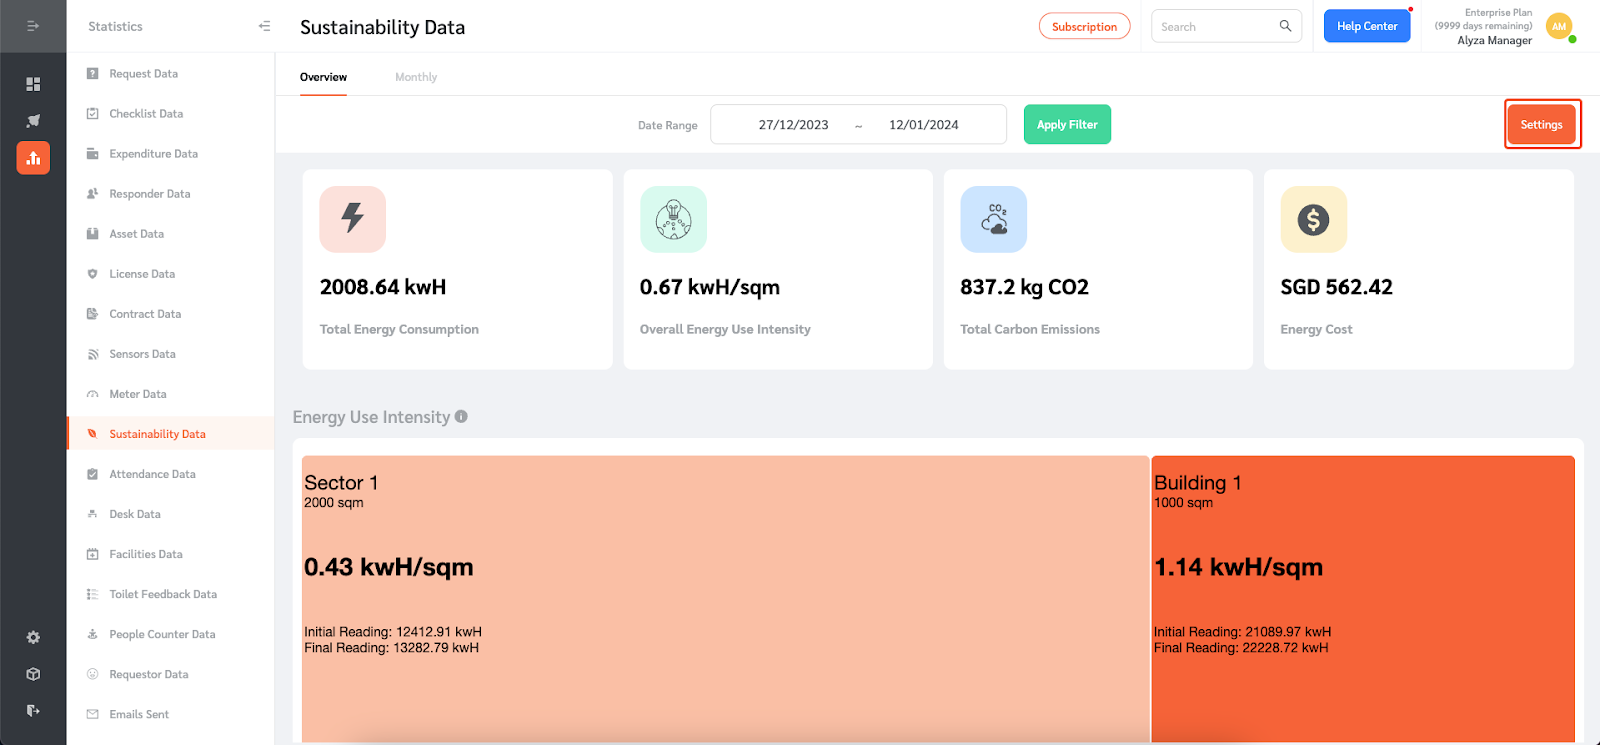
- Managers must first configure the sustainability data settings. Click on ‘Setting’ on the upper right.
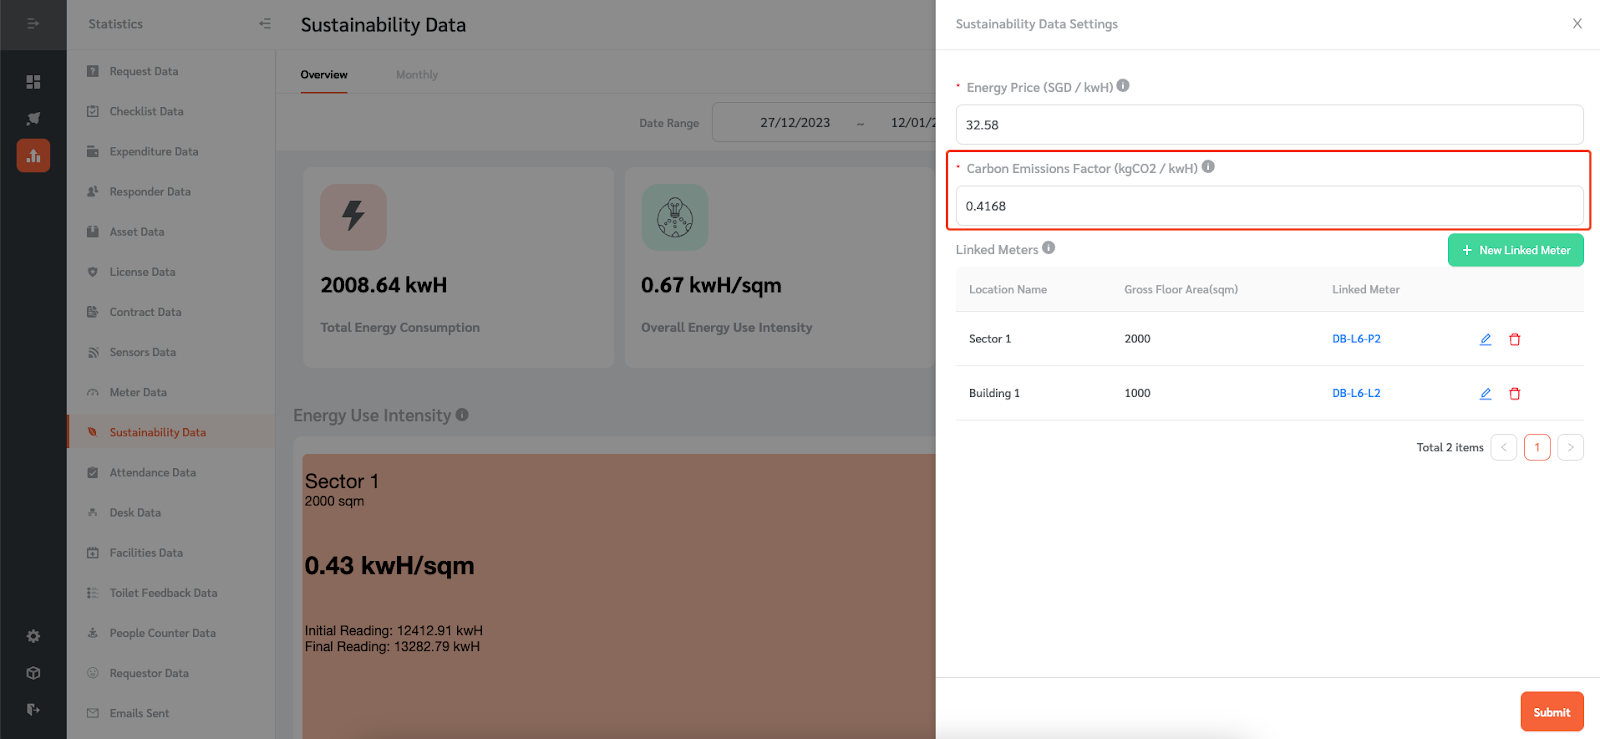
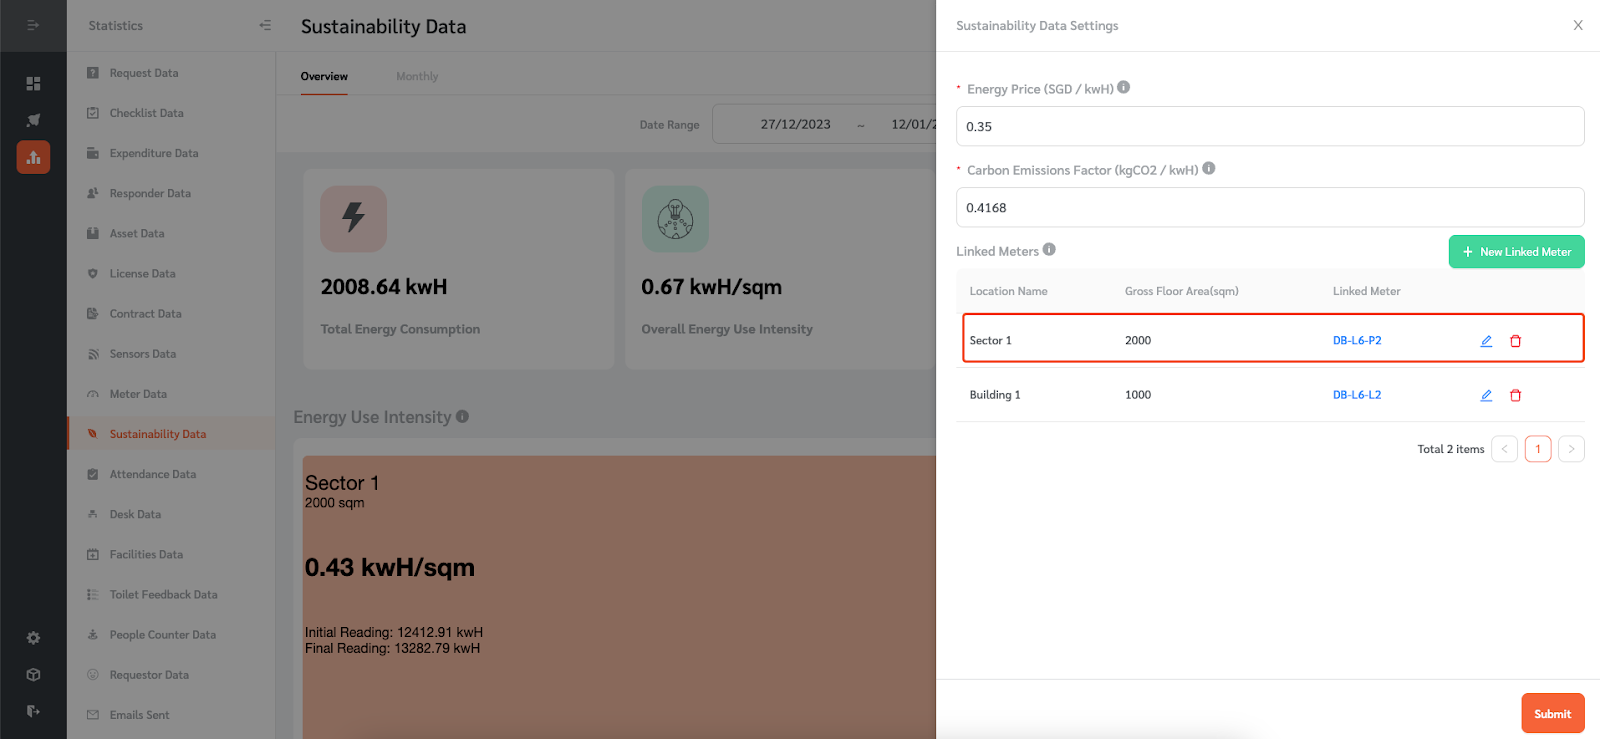
- A side panel will open. Enter the energy price per kwH. This will be used to calculate Energy Costs.
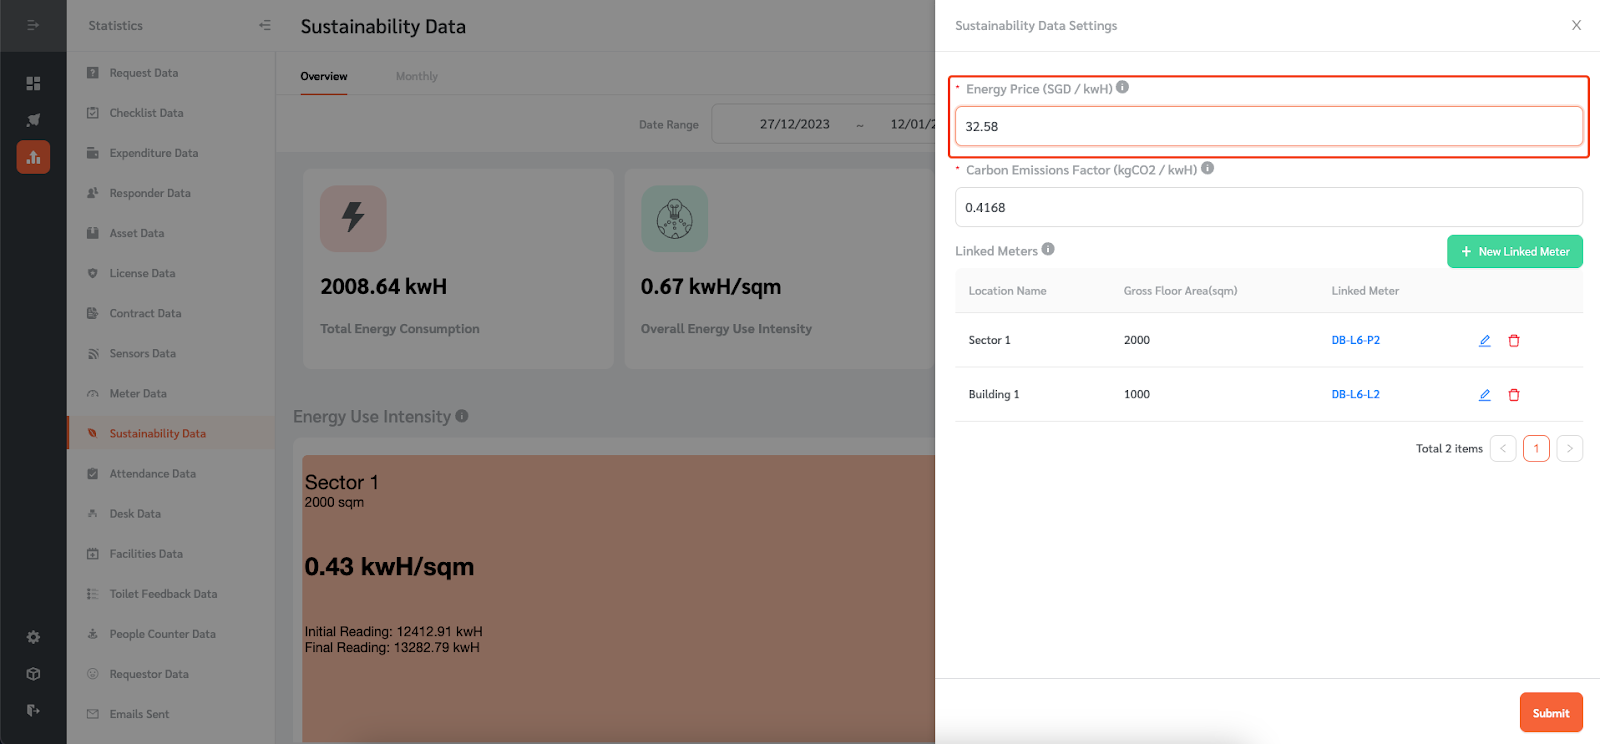
- Enter the Carbon Emissions Factor for your area to calculate Carbon Emissions based on Energy Consumption.
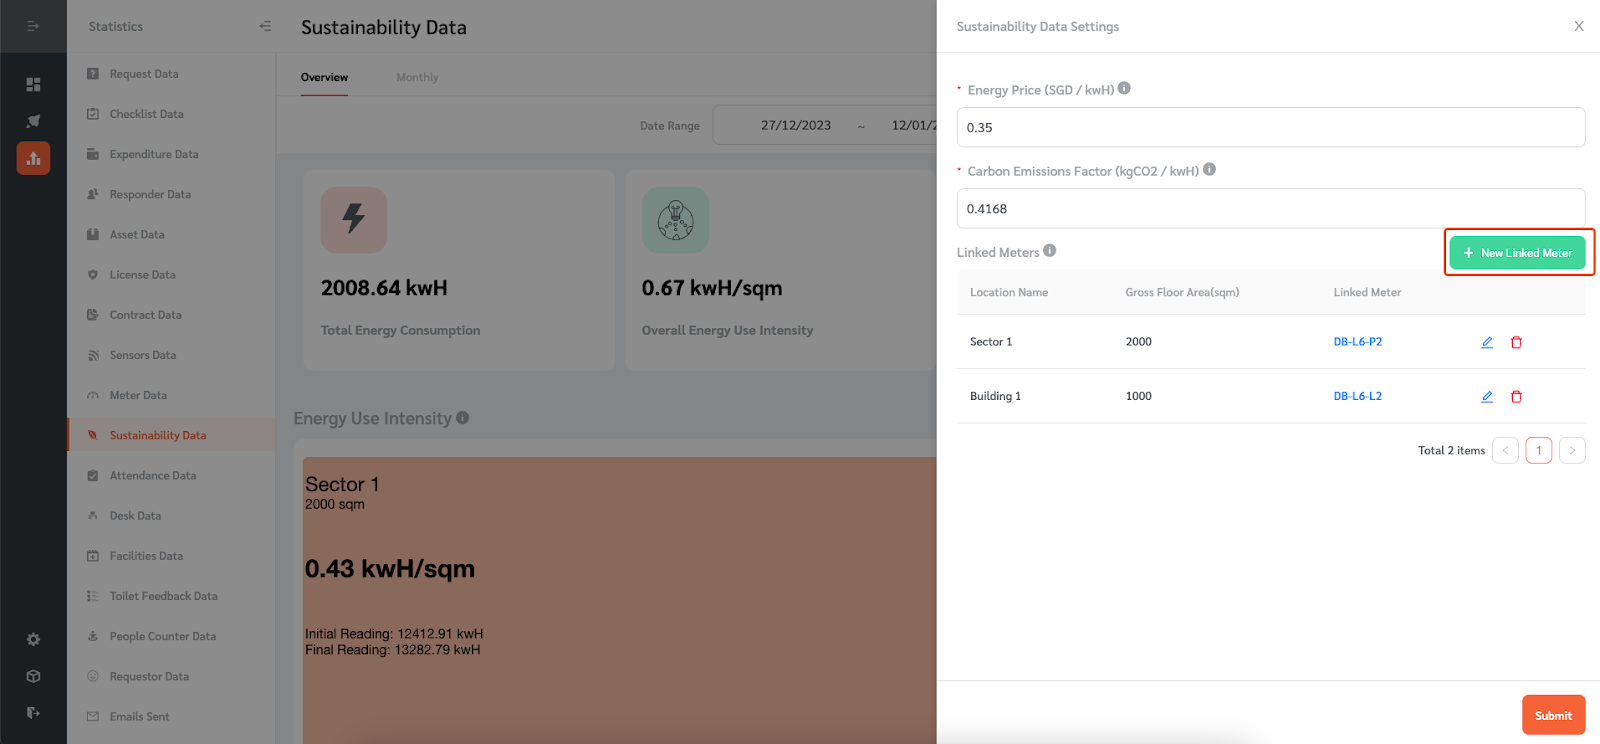
- The next step is to link meters whose energy consumption you want to view. Click on ‘+ Add New Meter’ to link a meter.
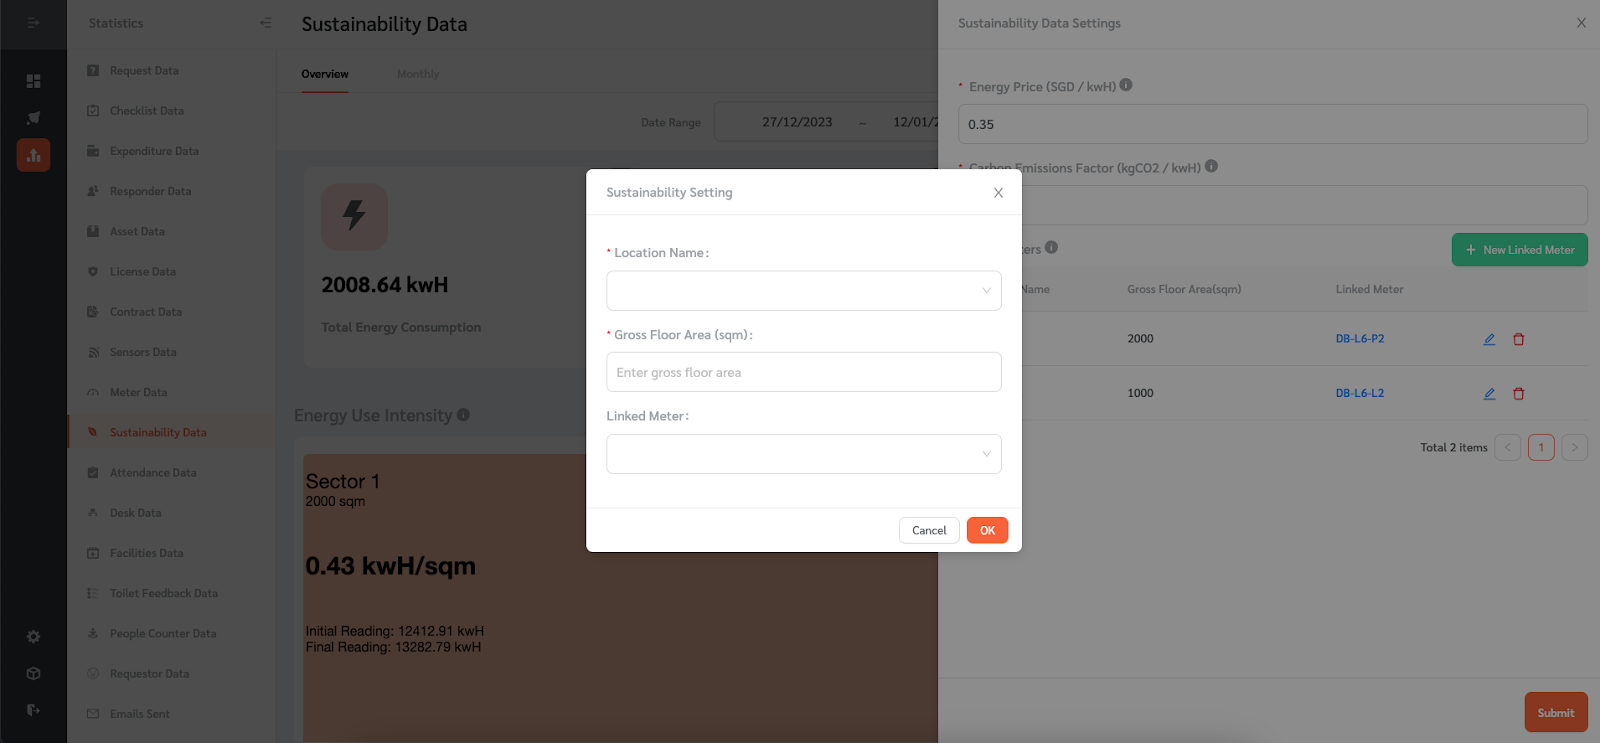
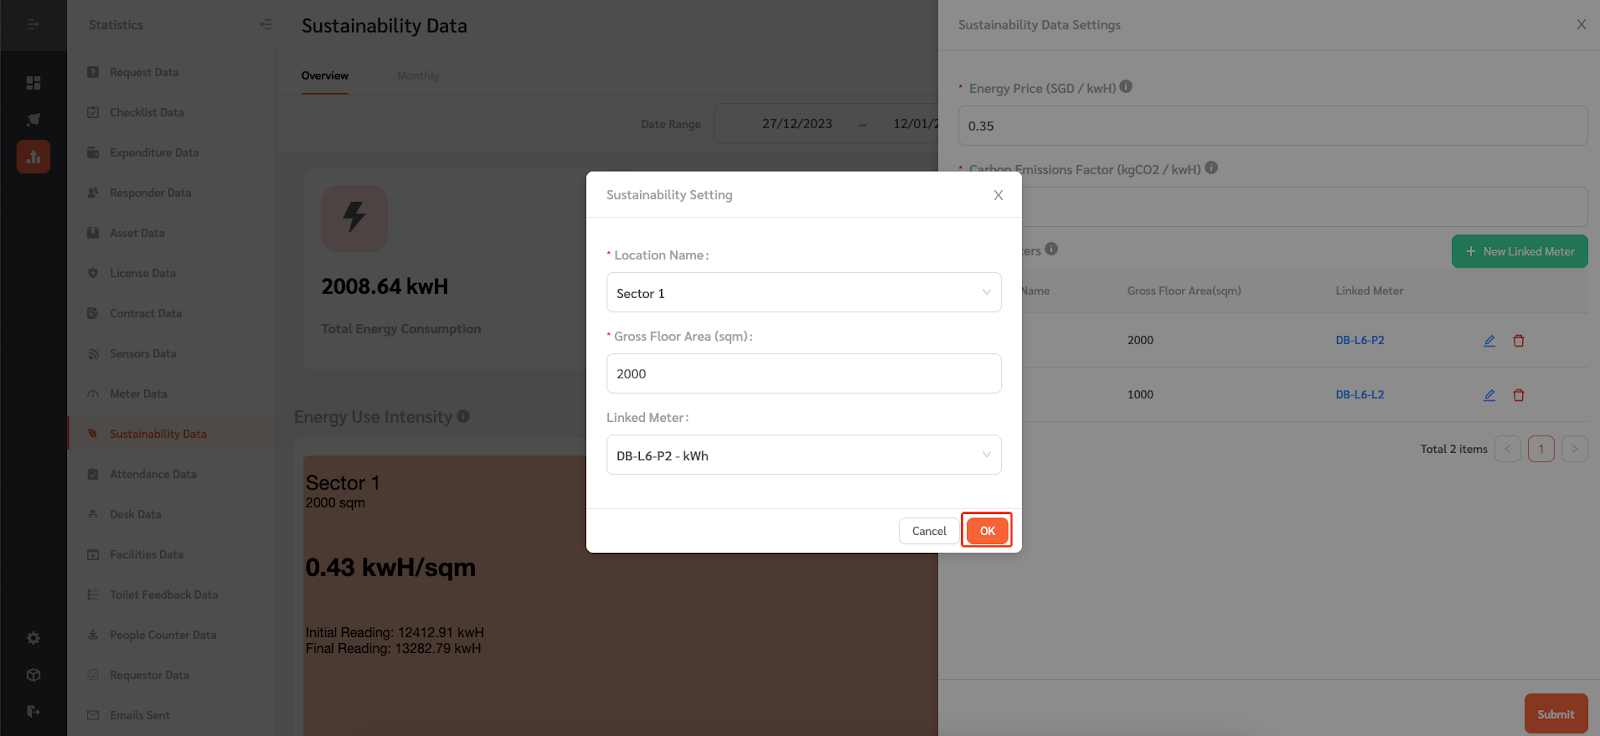
- A floating editing panel will appear where you can enter the meter details. Enter the location of the meter. Enter the gross floor area for that location in square meters. The Gross Floor Area will be used to calculate Energy Use Intensity.
- Choose the meter you want to link on the drop-down. The meter should be an Energy Consumption meter which measures Energy Consumption in kwH.
- Once done, click ‘Ok.’
- The newly linked meter will appear on the list of linked meters.
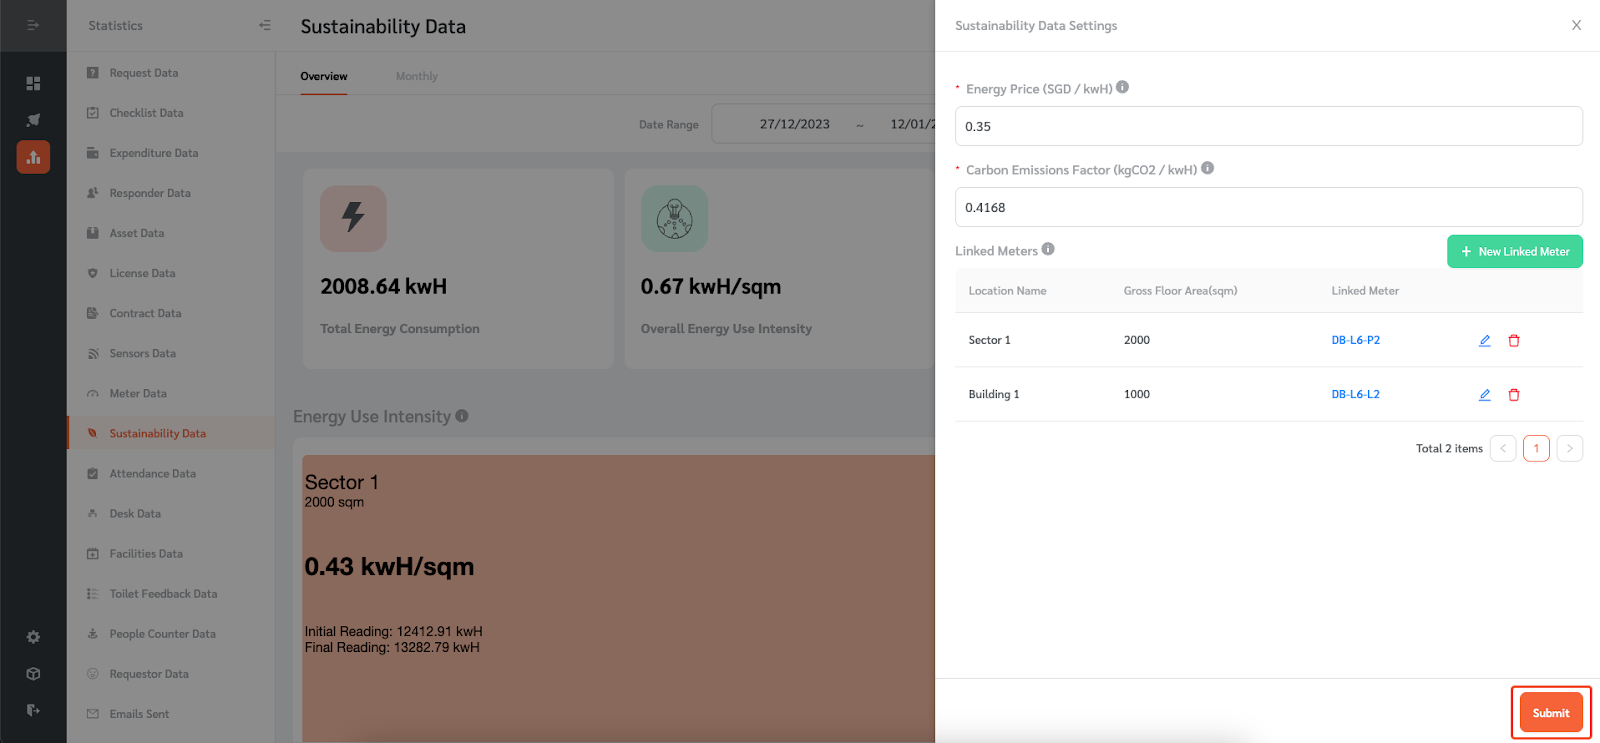
- After linking the meters, click ‘Submit.’
Viewing Sustainability Data
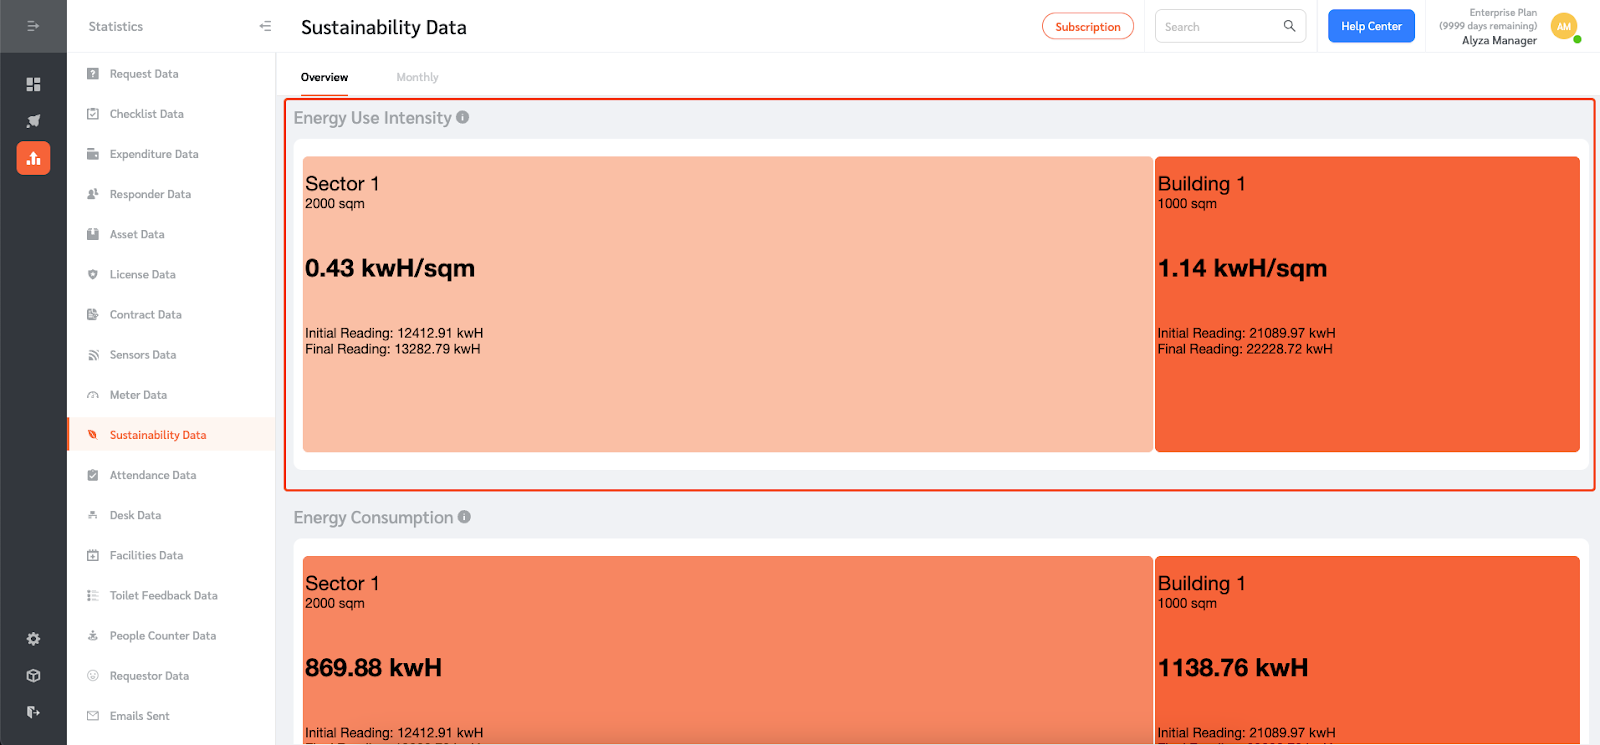
- Once the meters are linked, FacilityBot will calculate the Total Energy Consumption based on the energy consumption data from the meters.
- Facilitybot also calculates
- Overall Energy Use Intensity by dividing the Total Energy Consumption by the gross floor area
- Total Carbon Emissions by multiplying the Total Energy Consumption by the Carbon Emissions Factor; and
- Energy Cost by multiplying the Total Energy Consumption by the Energy Price.

- The Energy Use Intensity grid shows the Energy Use Intensity for each Location. The size of each box shows the relative floor area. The colour indicates the Energy Use Intensity level. The darker the color of the box, the higher the Energy Use Intensity Level.
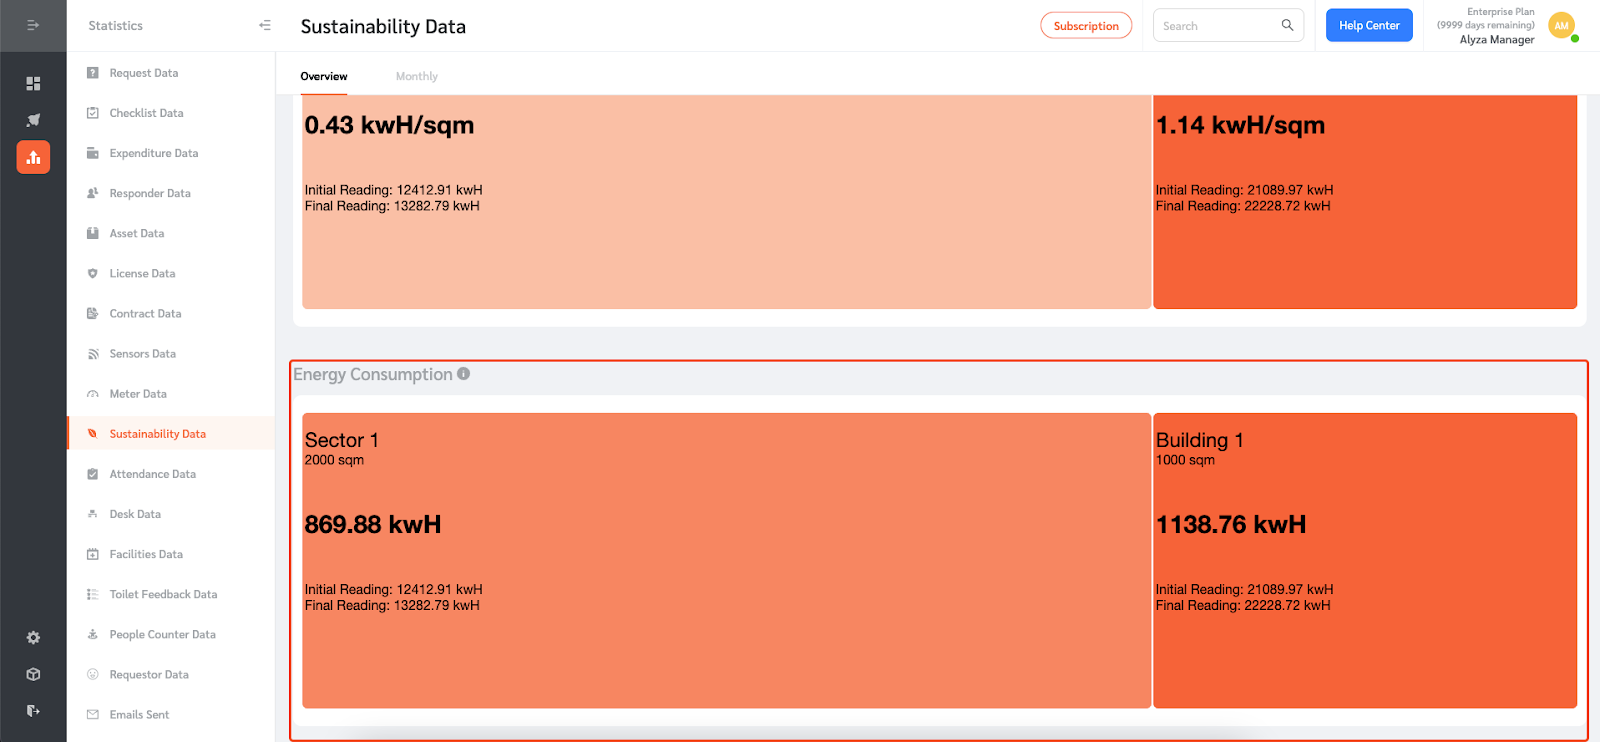
- The Energy Consumption grid shows the Energy Consumption for each Location. Similarly, the size of each box shows the relative floor area. The colour also indicates the Energy Consumption level.
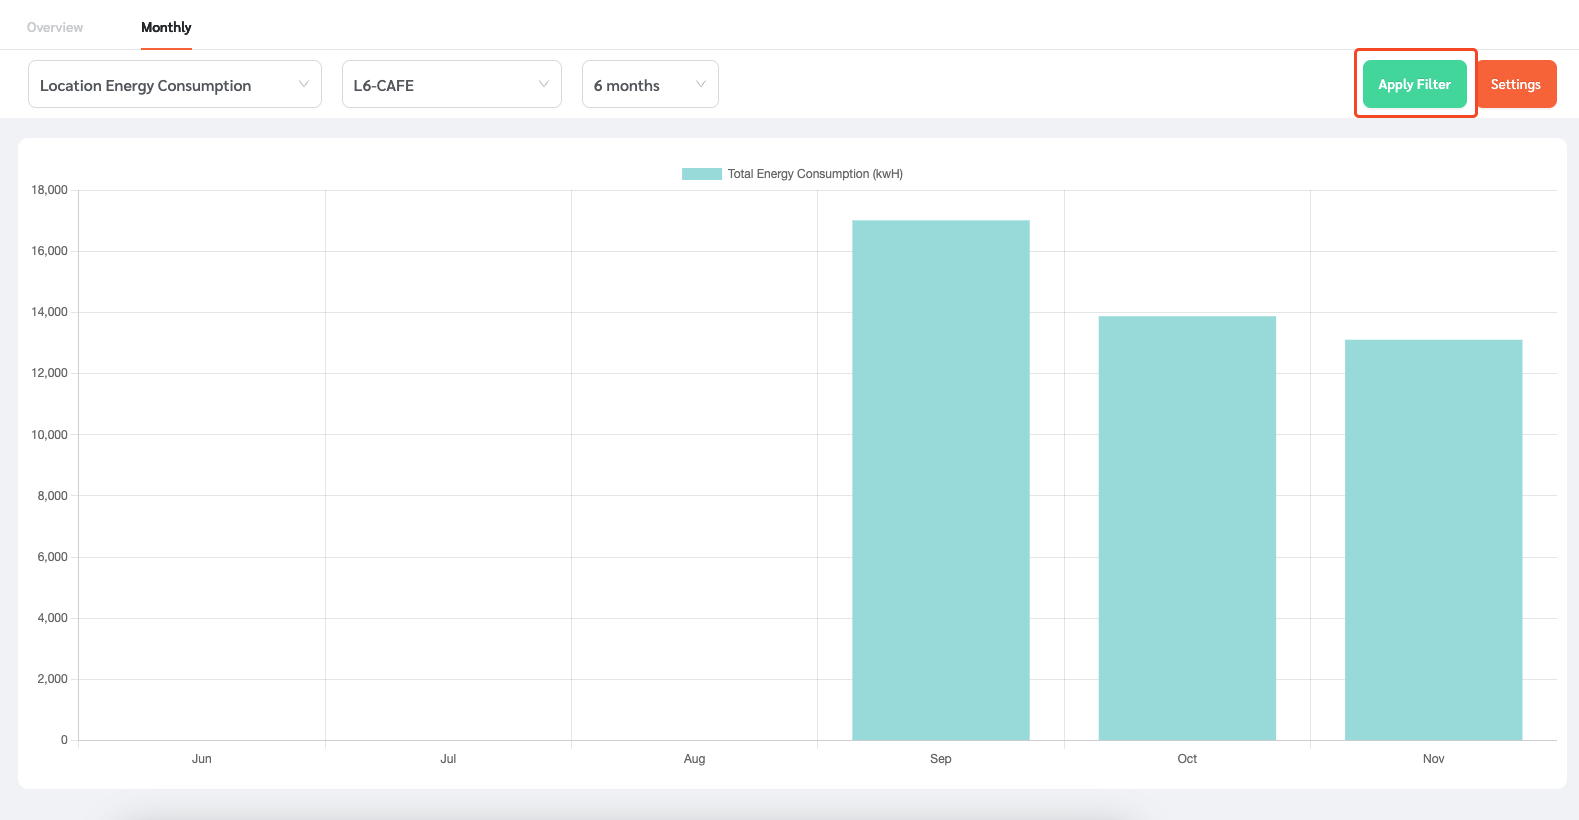
Managing Monthly Sustainability Data
- FacilityBot also shows you the monthly sustainability data.

- You can filter the data you want to see by selecting from the dropdown. You can view the total energy consumption or total energy usage intensity.
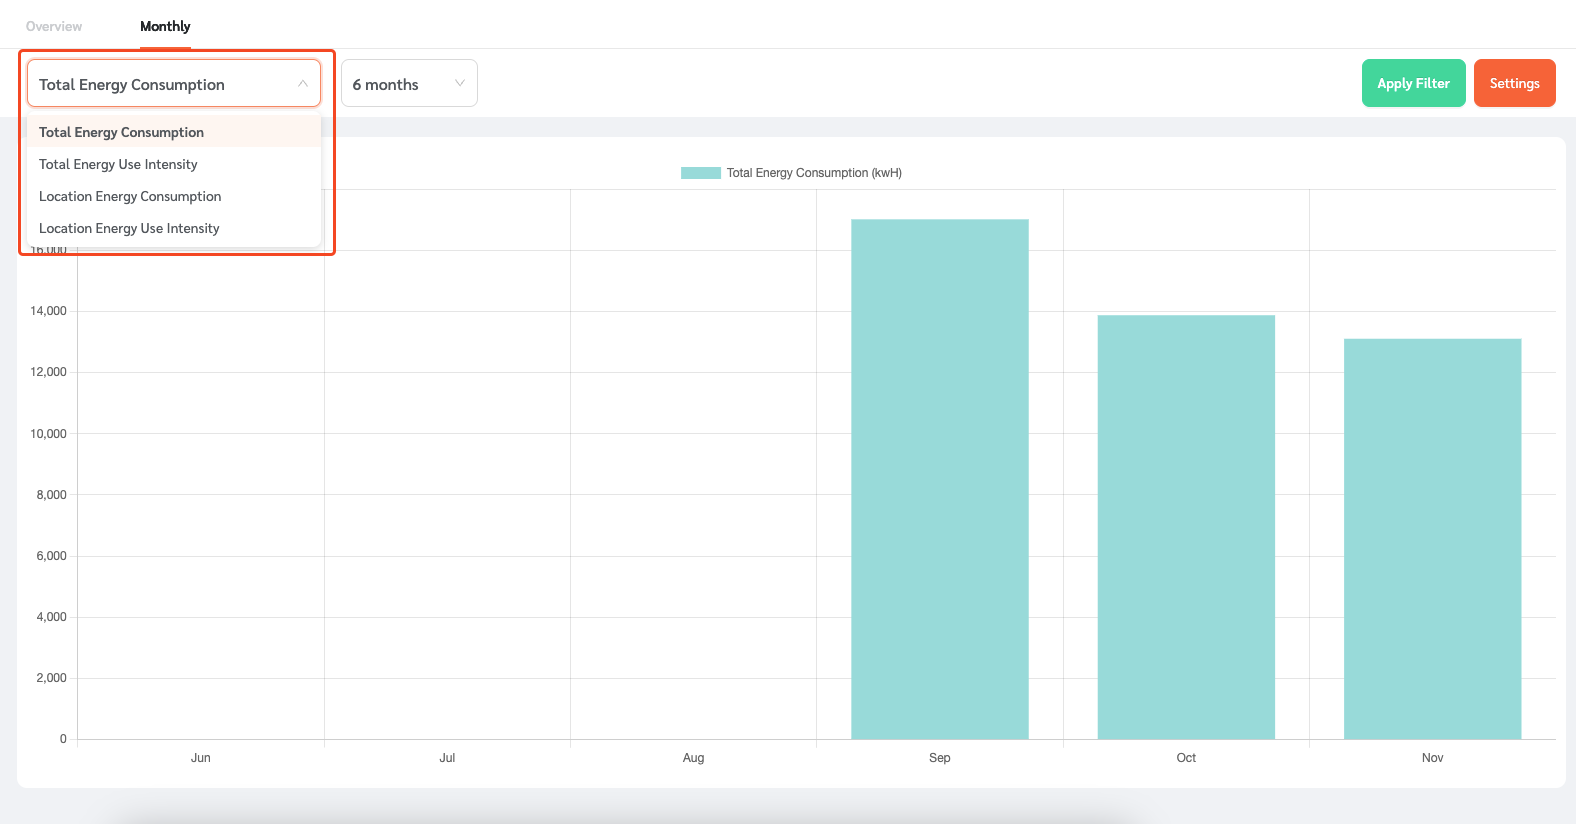
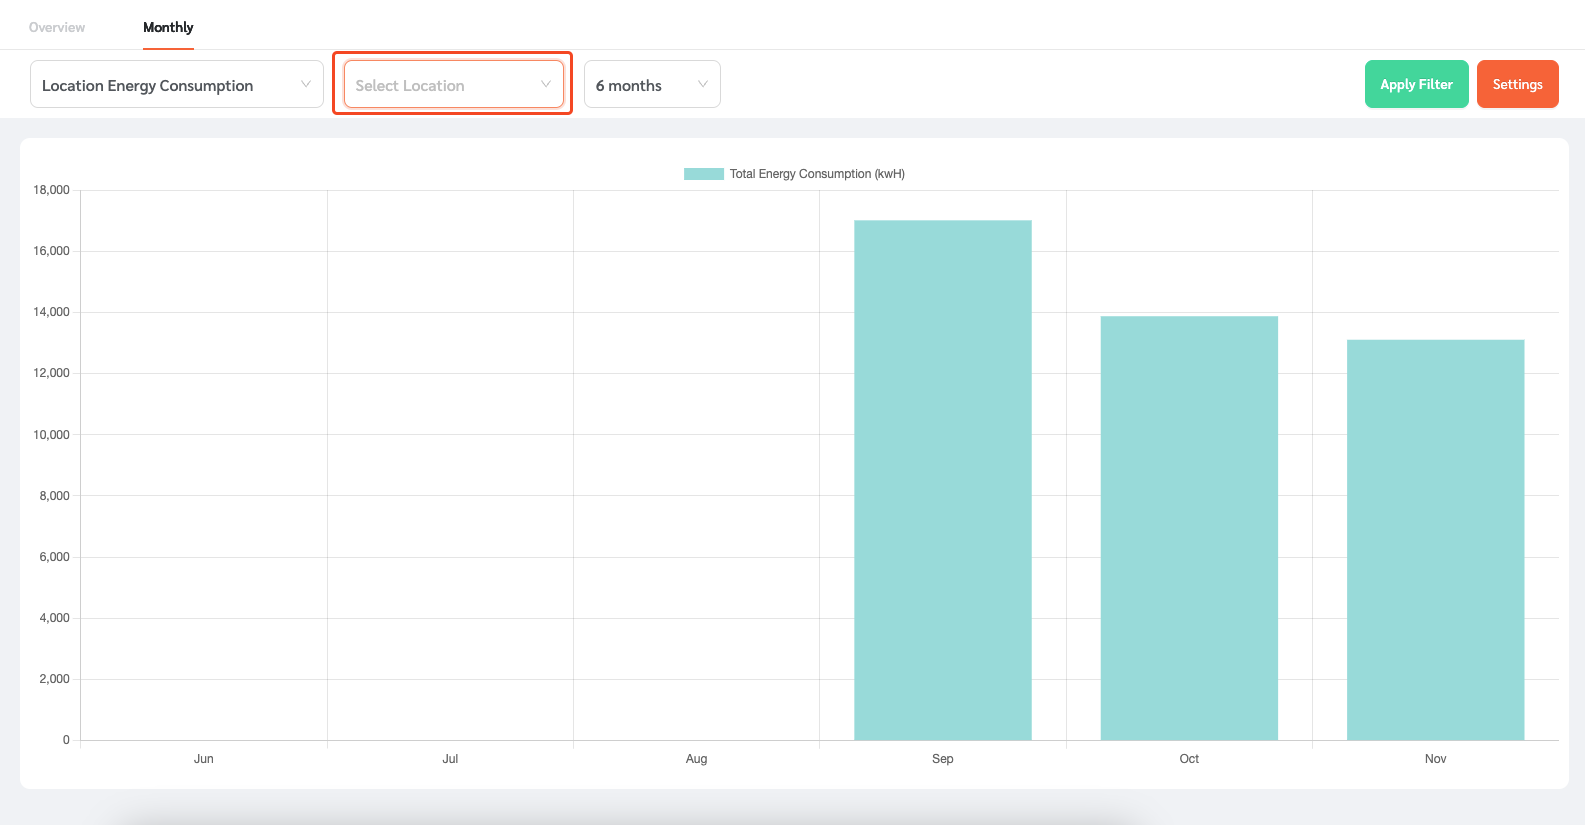
- You can also select location energy consumption, or location energy usage intensity. If this is selected, you will be asked to enter the location of the meter whose energy consumption or energy usage intensity you want to see.
- You can also select the date range. The date range can be the most recent 6 months, 12 months, or 24 months.
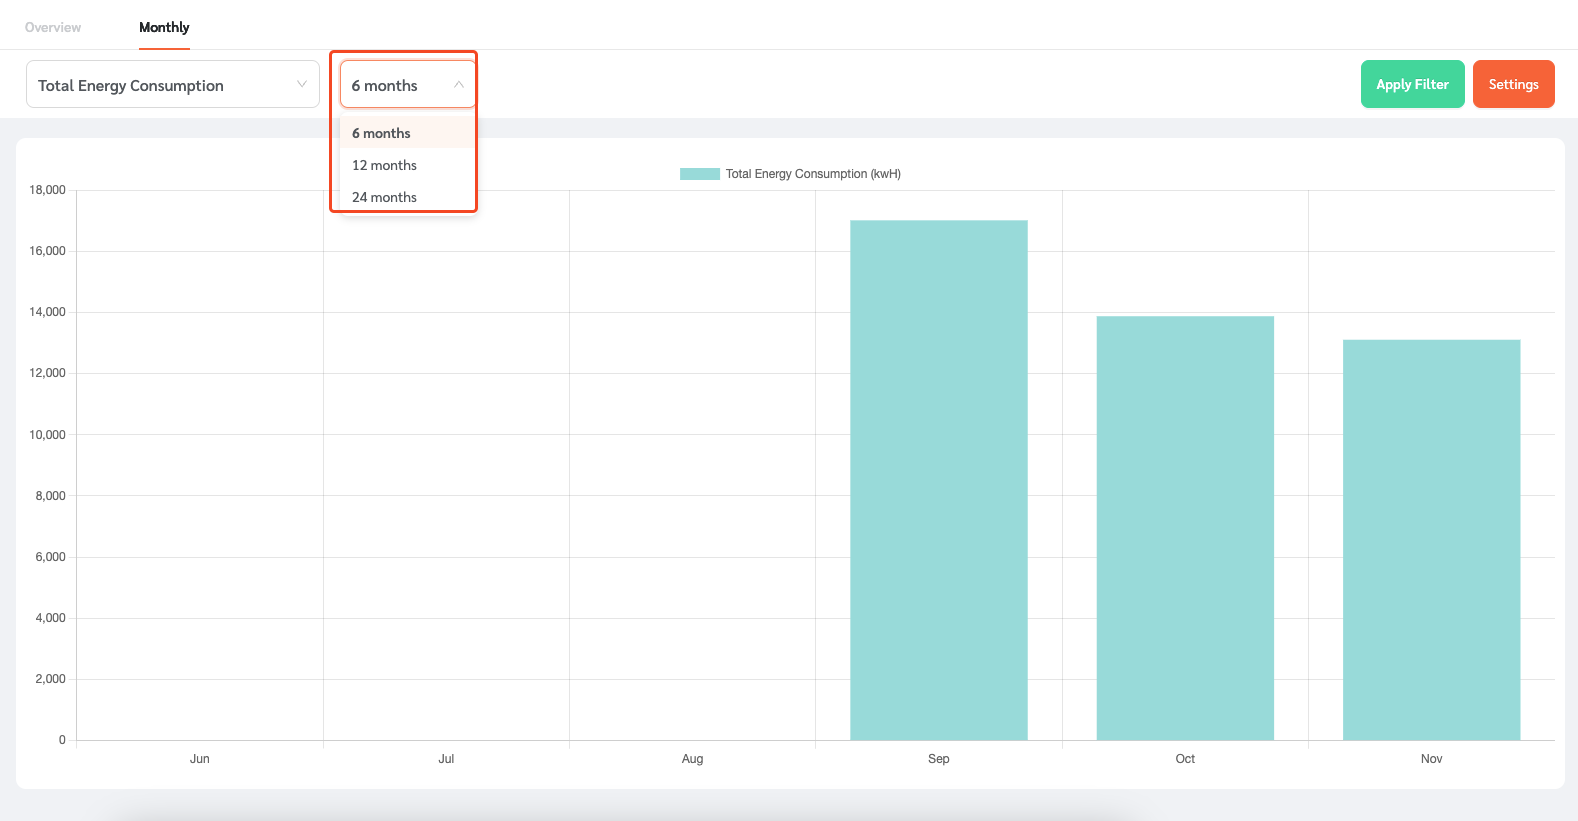
- Once the filter is selected, click on ‘Apply Filter.’