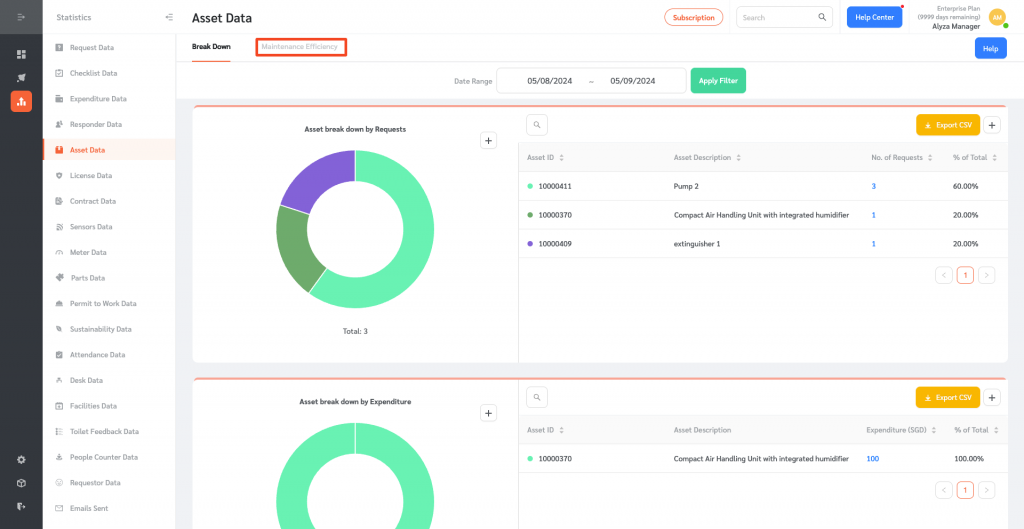
The Asset Statistics charts and tables aggregate the asset data including the breakdown by requests, breakdown by expenditure, and breakdown by downtime.
- To access this data, log in to FacilityBot Portal. Click on Statistics then Asset Statistics.
- This data can be filtered by Date Range.
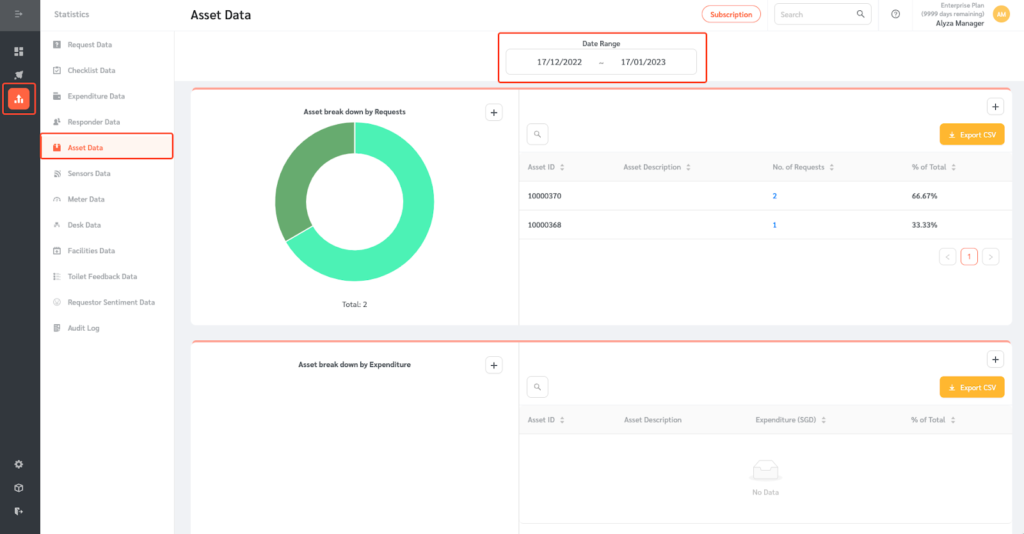
- The left side of the page shows a pie chart view of the asset data while the right shows a table view.
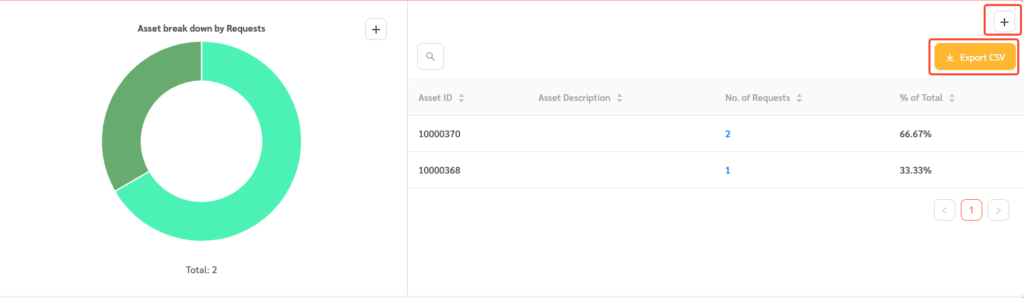
- Tables can be exported as a CSV file and added to a custom dashboard using the Plus icon.
- The numbers in blue are clickable to view the Request or Expenditure in question.
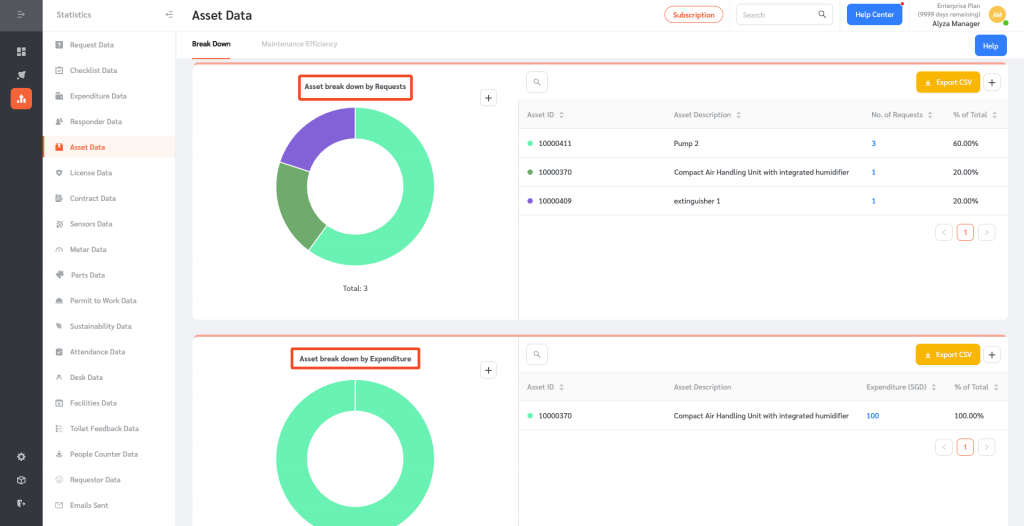
- The charts and tables shows the asset break down by Requests, Expenditure, and Downtime.
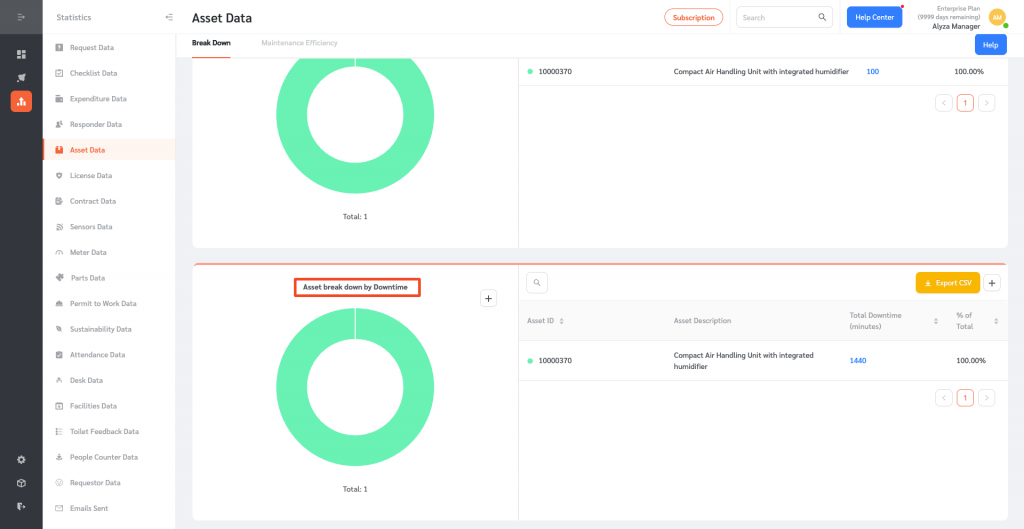
- Managers can also access the maintenance efficiency chart from the asset data.