Reporting is a key part of a Facility Manager’s daily work. To reduce the need for manual data collation, FacilityBot auto-generates various key charts, and tables to help Facility managers with their reporting tasks.
- To access the Statistics, log in to FacilityBot and select Request statistics.
- Here, you can view the Request Response Times, Request Breakdowns by different factors, and Request Response times measure versus configurable thresholds (KPIs) set.
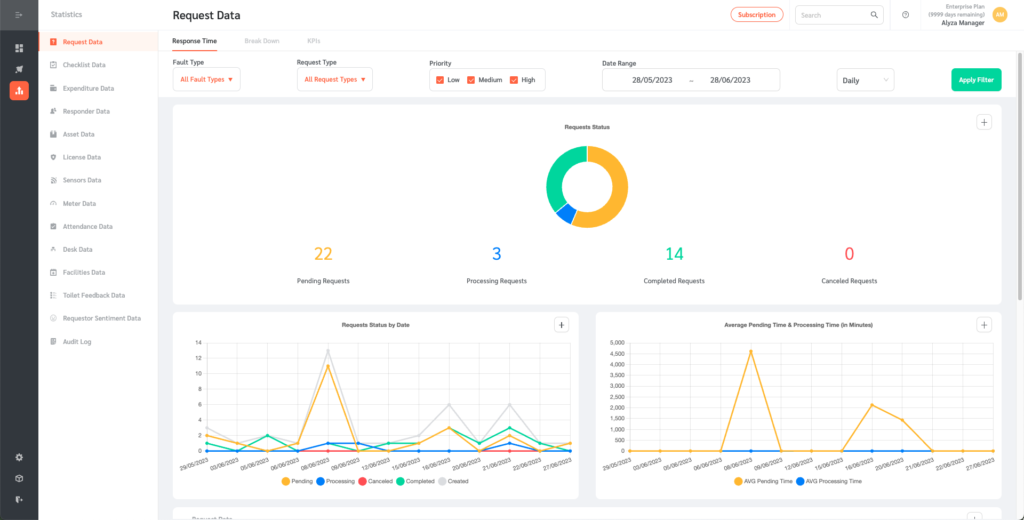
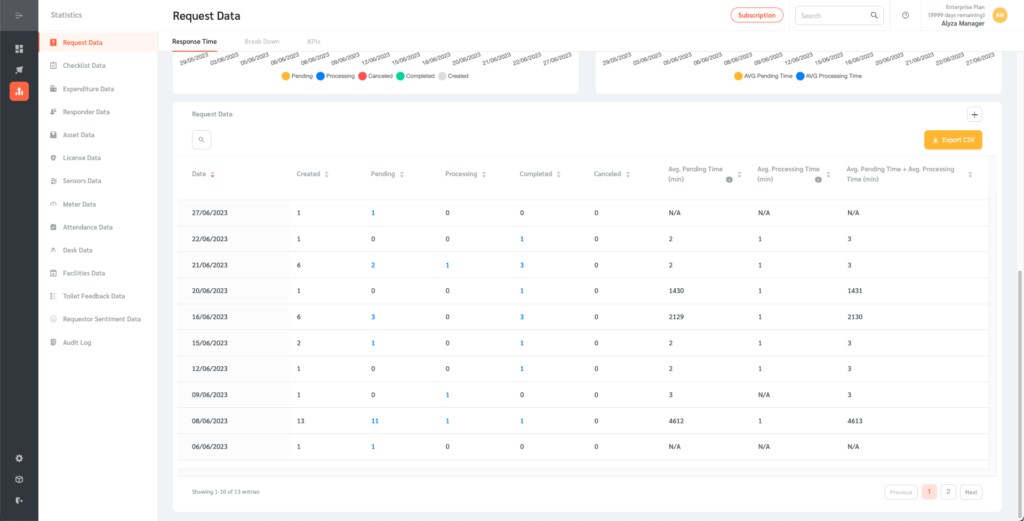
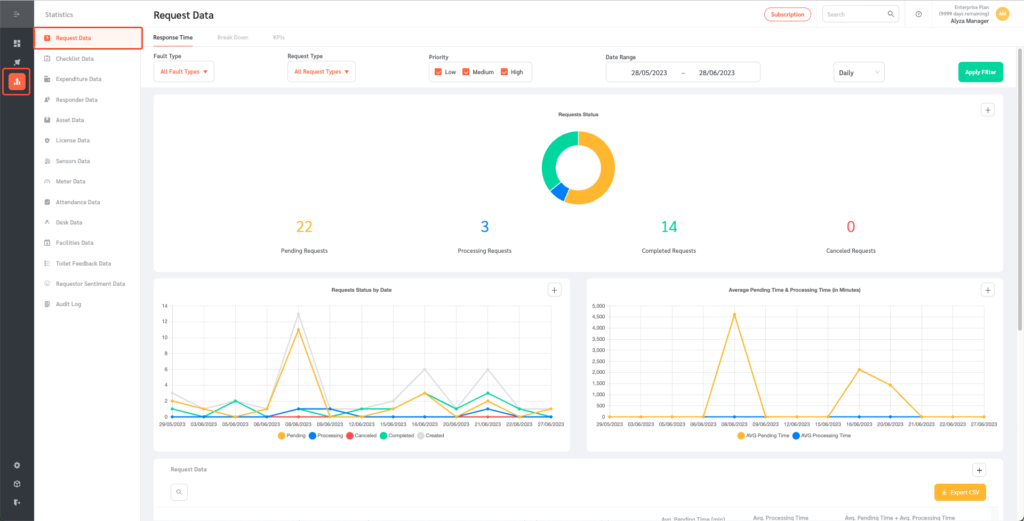
Request Status and Response Times
- The response status and response times charts and tables aggregate the current statuses of all requests and their average pending and processing times.
- The average pending time is the average time that requests spend in the “Pending” state
- The average processing time is the average time that requests spend in the “Processing” state
- This can be filtered by Fault Type, Request Type, Priority, and Date Range.
- You can also view the data in Daily or Monthly periods
- Once all the filters have been added click on the “Apply Filter” button.
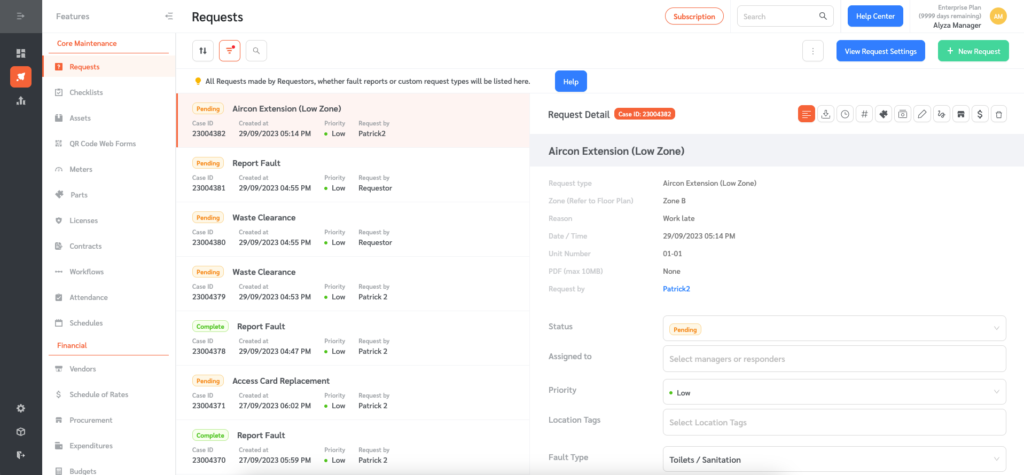
- Numbers in blue in the Request Data table are clickable. Clicking on these numbers will conveniently lead the user to the requests in question.
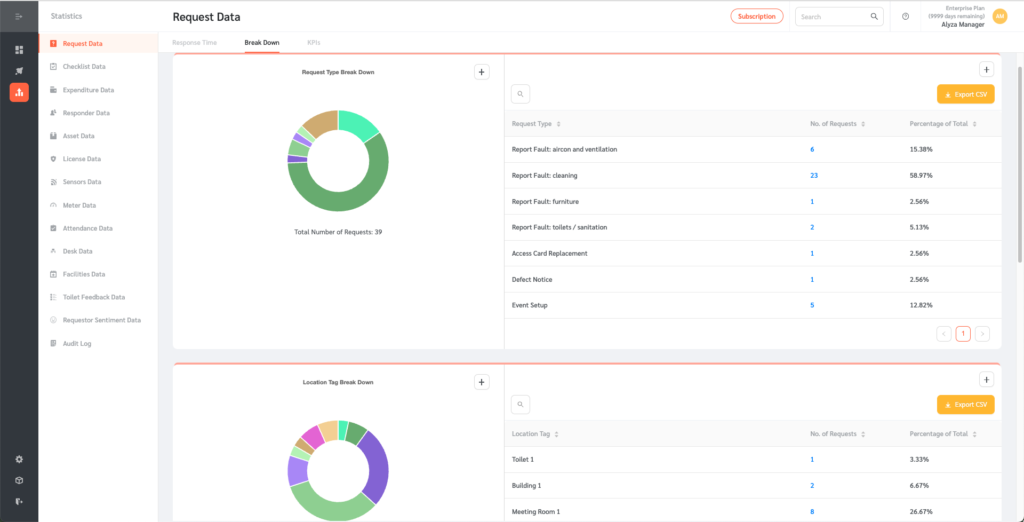
Request Data Breakdowns
- On this page, Request data is broken down based on Request Types, Location Tags, and the hour of the day.
- The Request data breakdowns can also be exported as CSV by clicking on the “Export CSV” on top of each table.
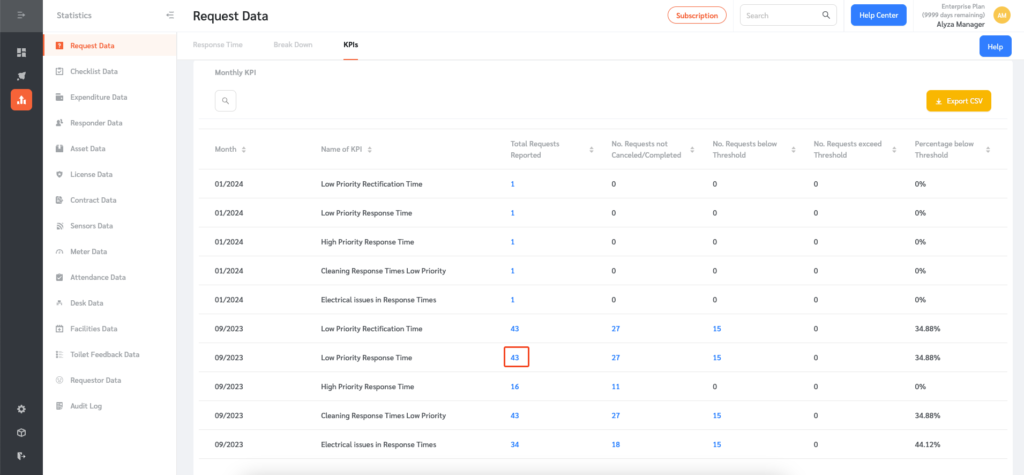
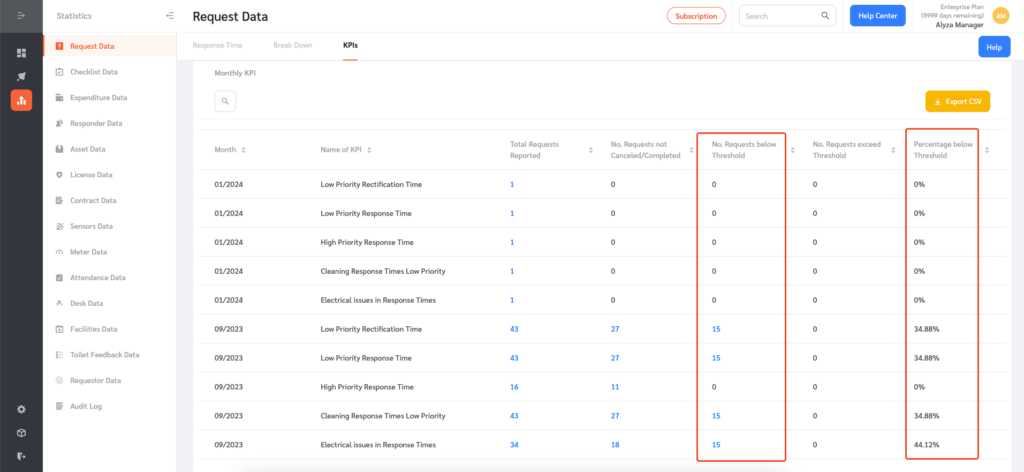
KPIs
- This page allows the user to define KPI thresholds based on specified factors
- To create a KPI, select KPIs and click on the + New KPI button on the upper right.
- An editing panel will appear. Give your KPI a name. Select the set of requests that should be considered for this KPI threshold. For example, a KPI threshold may apply only to requests of specific priority levels, fault types, or request types.
- Applicable periods can also be specified. If a request was made within the specified applicable periods, then it will be measured against the threshold.
- Once done, click the “Create” button to save the changes

- Once the KPI threshold is set, the number of requests that fall below the threshold and the monthly percentage below threshold numbers will be automatically computed.
- The number of requests that exceed the threshold will also be automatically computed.
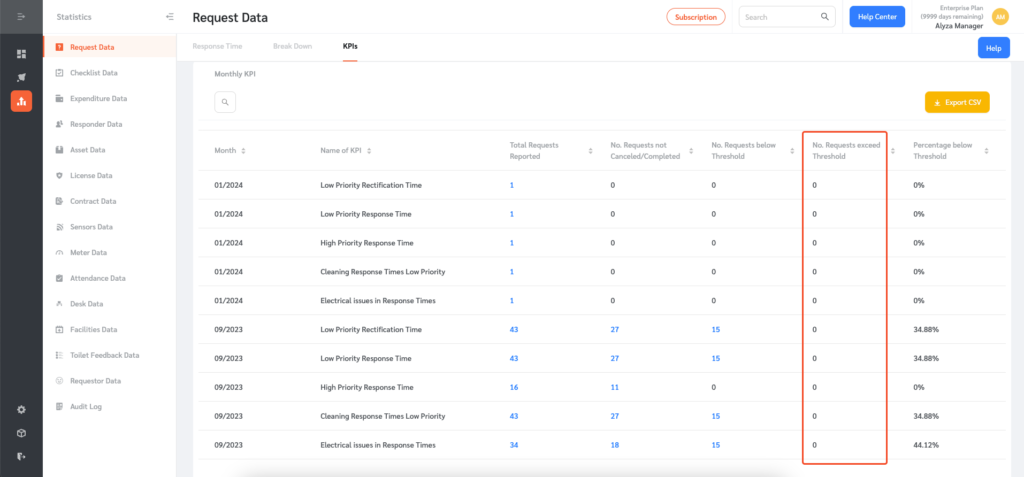
- The numbers in blue are clickable to show the requests in question.