The Responder Statistics charts and tables aggregate the responder data including the request rectification time and checklist completion.
- To access this data, log in to FacilityBot Portal. Click on Statistics then Responder Statistics.
- This data can be filtered by Date Range.
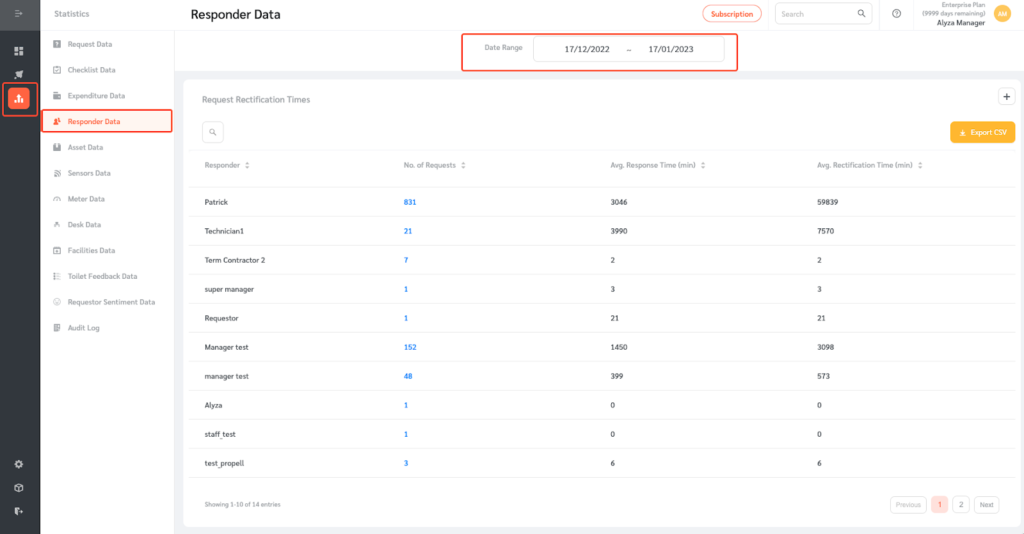
Request Rectification Times
The Request Rectification Time shows the average completion time of fault reports and service requests.
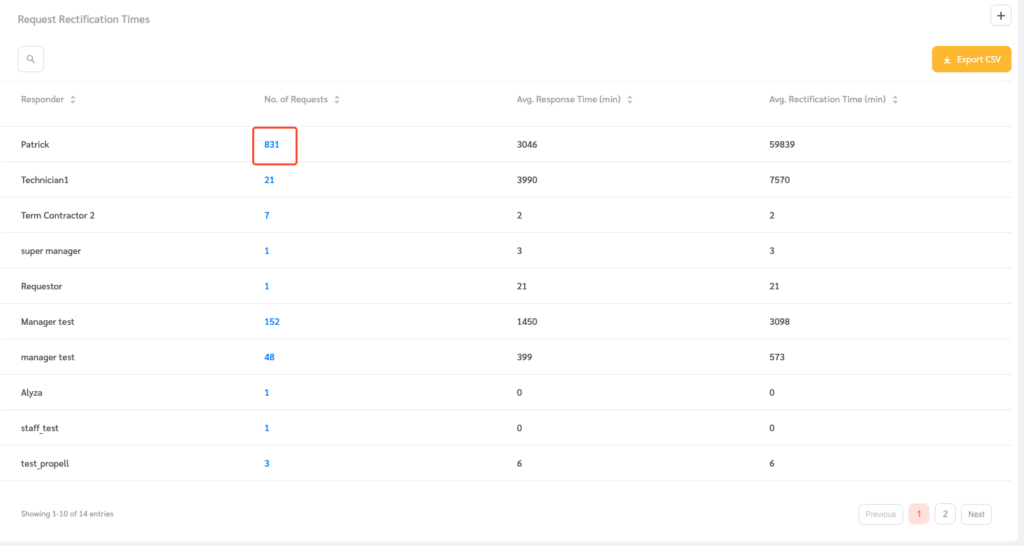
- Here, you can view the number of requests that have been assigned to each Responder. It also shows the average response time and average rectification time of each Responder in minutes.
- The numbers in blue are clickable to view the requests in question.
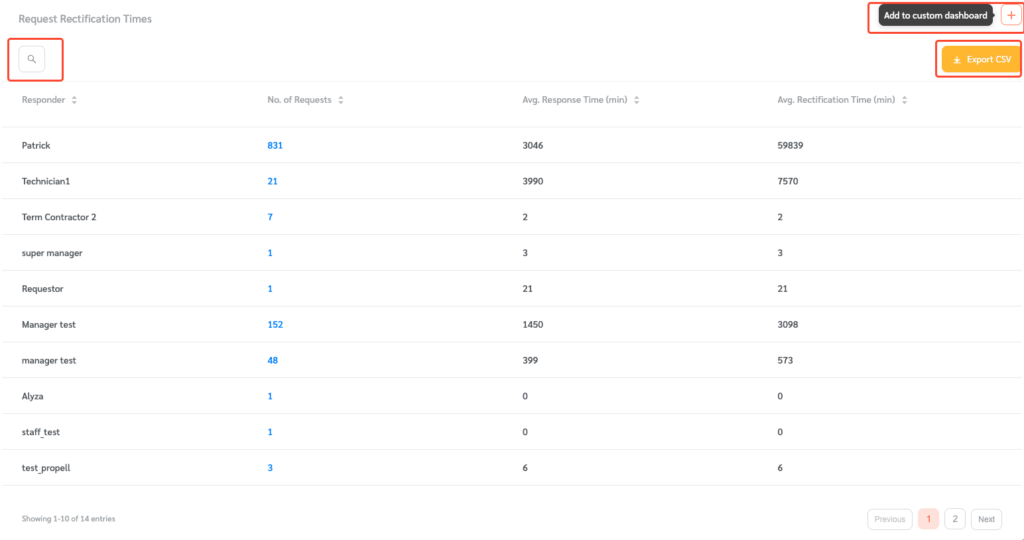
- Use the search field to search for a specific Responder.
- The table can also be exported as a CSV file using the Export CSV button.
- Click on the Plus icon to add the table to a custom dashboard.
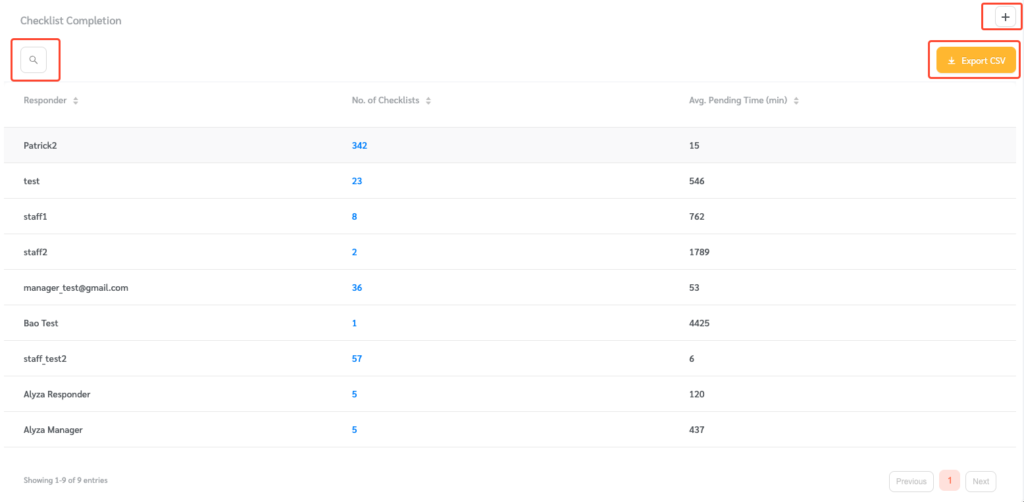
Checklist Completion
The Checklist Completion table shows the average completion time of preventive maintenance checklists.
- Here, you can view the number of checklists that are assigned to Responders. It also shows the average pending time in minutes.
- The numbers in blue are clickable to view the checklists in question.
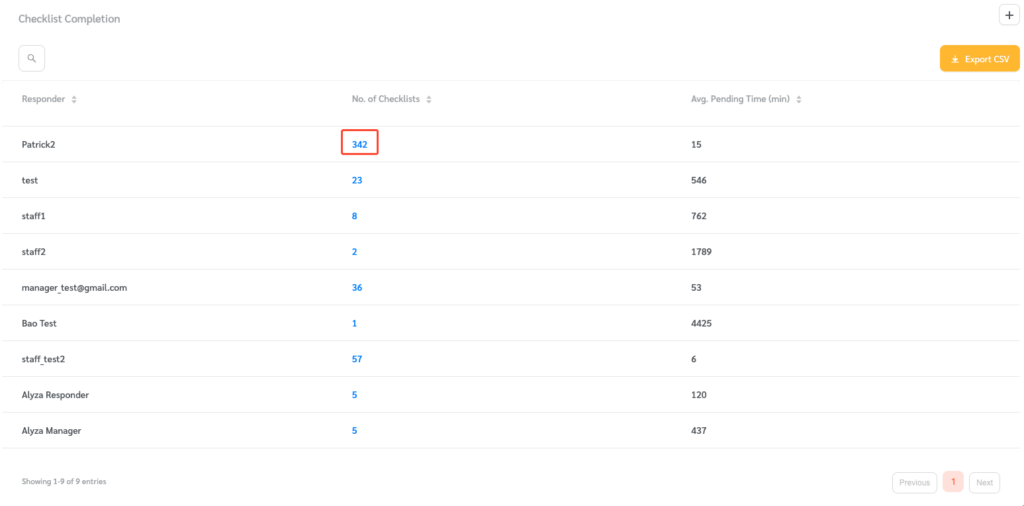
- Use the search field to search for a specific Responder.
- The table can also be exported as a CSV file using the Export CSV button.
- Click on the Plus icon to add the table to a custom dashboard.