FacilityBot’s Meter feature allows facility managers to track utility consumption and asset usage. FacilityBot enables easy creation of meters of any type, including equipment usage, water, and energy meters. Meter readings can then be entered for each meter and aggregated in FacilityBot for easier analysis in the future.
Creating New Meter
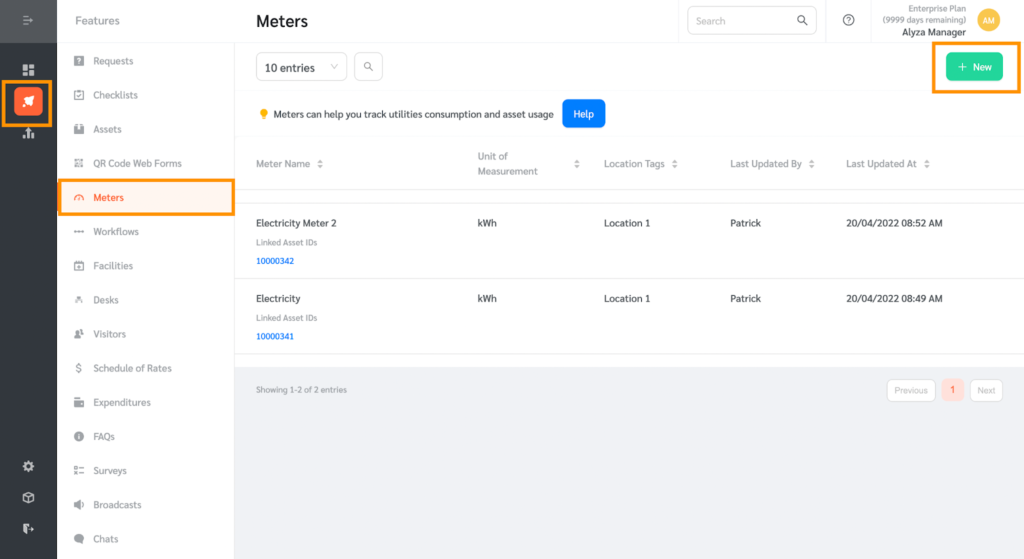
- To use this feature, log into the FacilityBot manager portal. Go to Features, then Meters
- Create a new meter by clicking on the + New button.
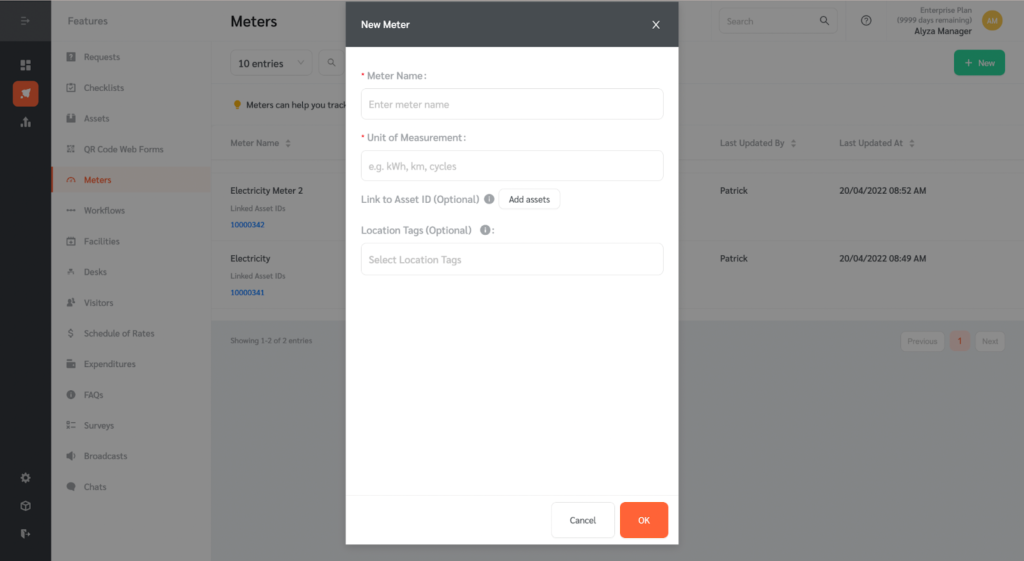
- On the floating editing panel, enter the name of the meter you want to create as well as the unit of measurement.
- FacilityBot allows linking of meters to assets. Once an asset is linked, facility managers can view the meter data from the asset perspective.
- Location tags can also be added to indicate where the meter is placed.
- Once done, click “Ok.”
Entering Meter Reading
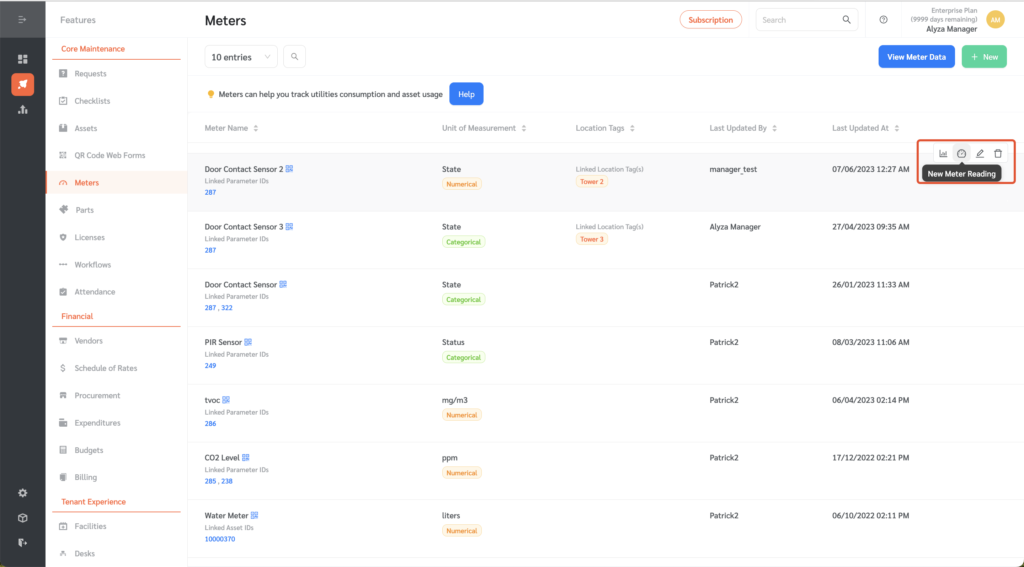
- Back on the main page, meter readings can be entered.
- Hover on a selected meter and click on the “Enter Meter Reading” icon.
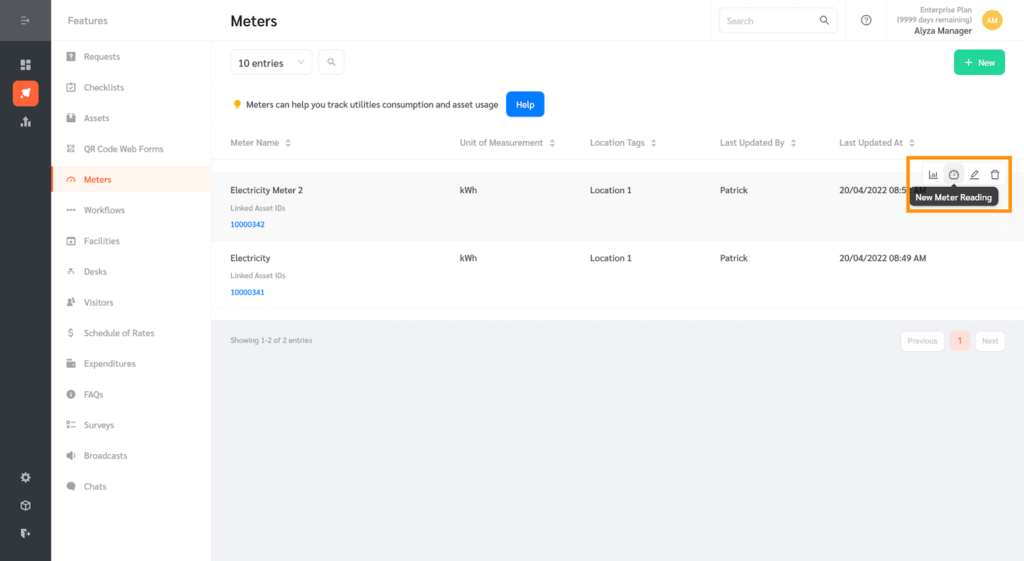
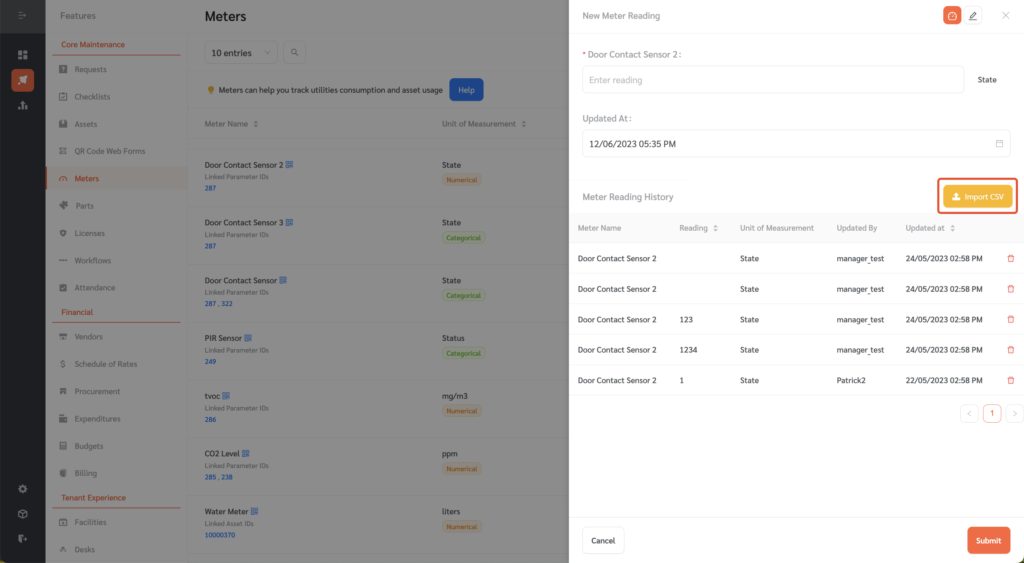
- An editing panel on the right will appear.
- Enter the reading on the meter reading field.
- Meter reading history is also shown.

- Once entered, click “Submit”.
- FacilityBot will store all recorded readings for future analysis of cumulative and average data.
Importing Meter Reading from CSV/Excel File
- FacilityBot allows you to import Meter Readings from a CSV/Excel file.
- Click on the “New Meter Reading” icon.
- A side panel will open on the left. Click on the “Import CSV” button.
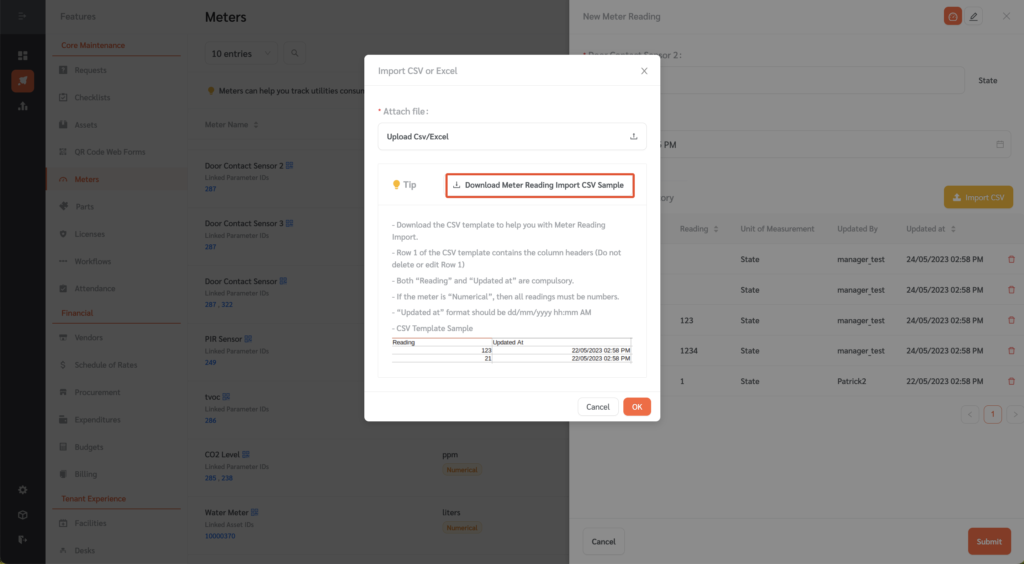
- A floating editing panel will appear where you can download the Meter Reading Import CSV template.
- Download the template to populate the CSV/Excel file.
- Once populated, you can click on the “Upload CSV/Excel” button to import the meter readings.
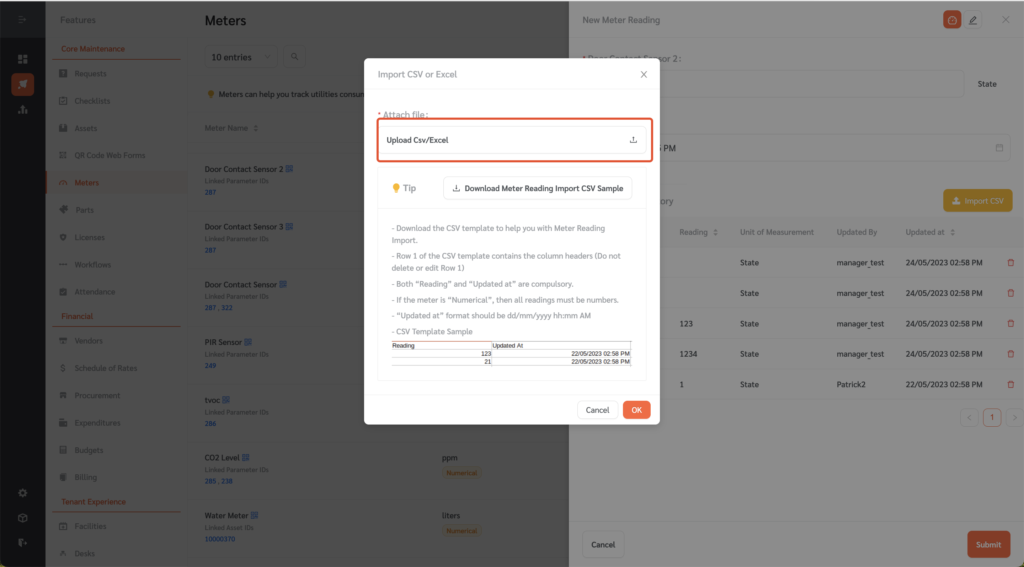
- Once uploaded, the meter readings will be imported. The newly imported meter readings will appear on the Meter Reading History section.
Viewing Raw Meter Data
Meter data can be viewed in raw data or aggregated form.
- Click on the “Meter Statistics” icon to view meter data.
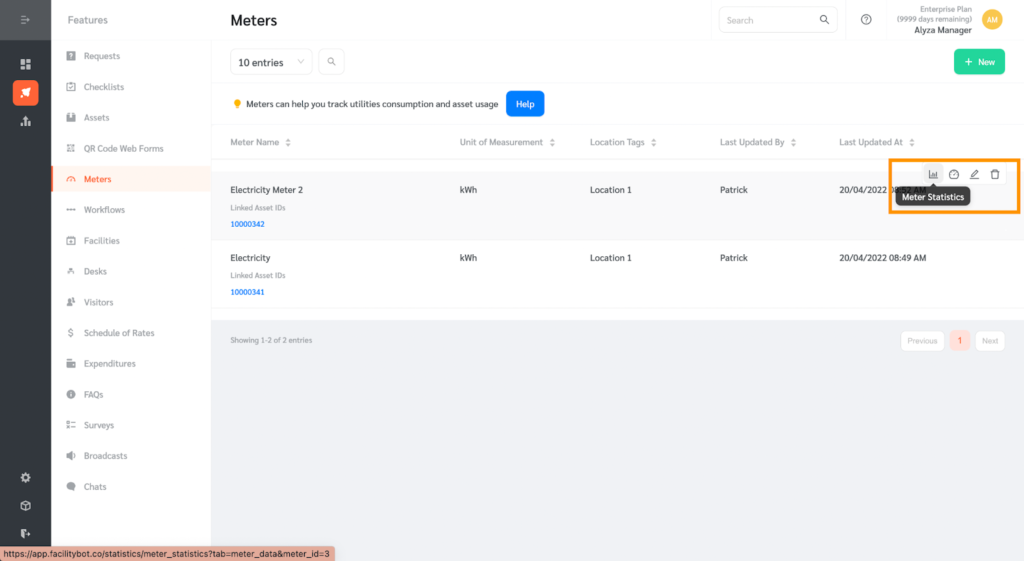
- You can also navigate to “Statistics” then “Meter Statistics” to view meter data.
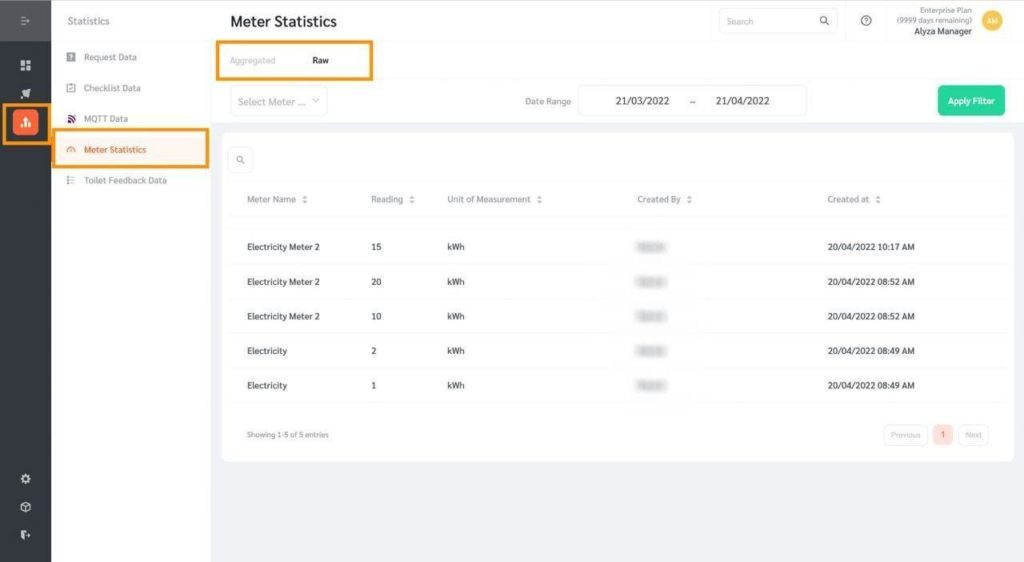
- Raw meter data shows a list of all meter readings.
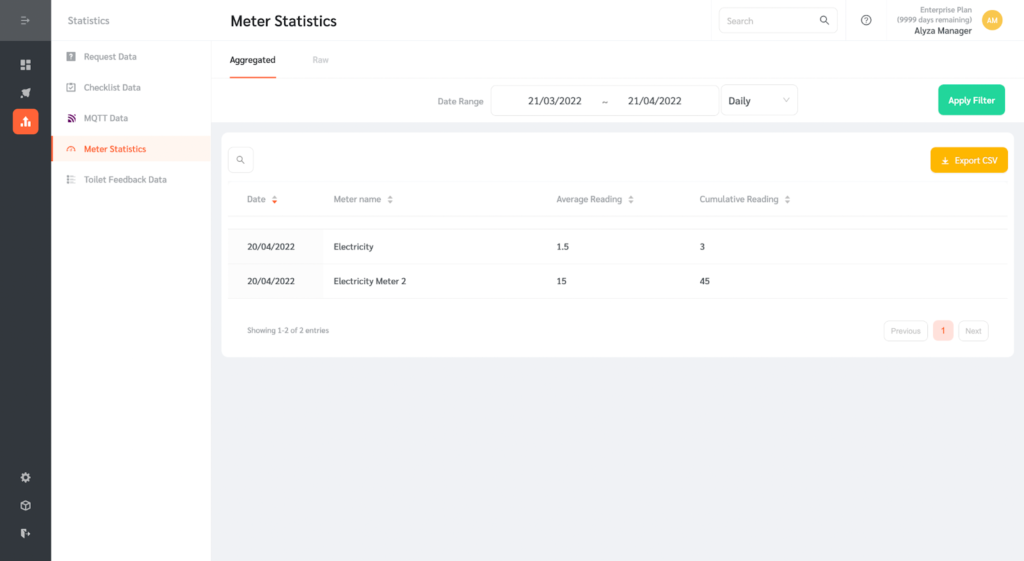
- The aggregated meter statistics show the daily or monthly average and cumulative readings for each meter.
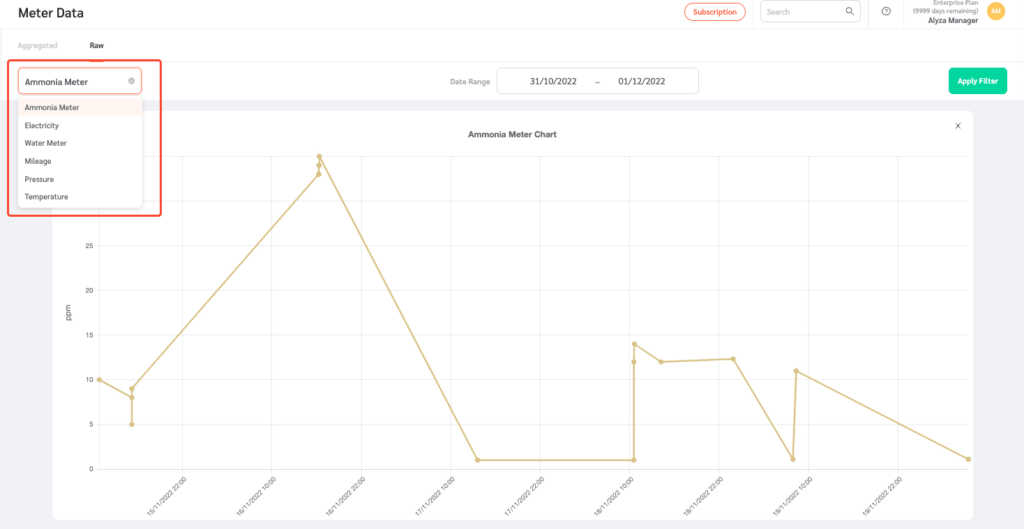
Viewing Meter Graph
- To view the graph, click on the chart icon. You can access this by going to Statistics, then Meter Data. Or, you can go to Features, Meters, then click on Meter Statistics.
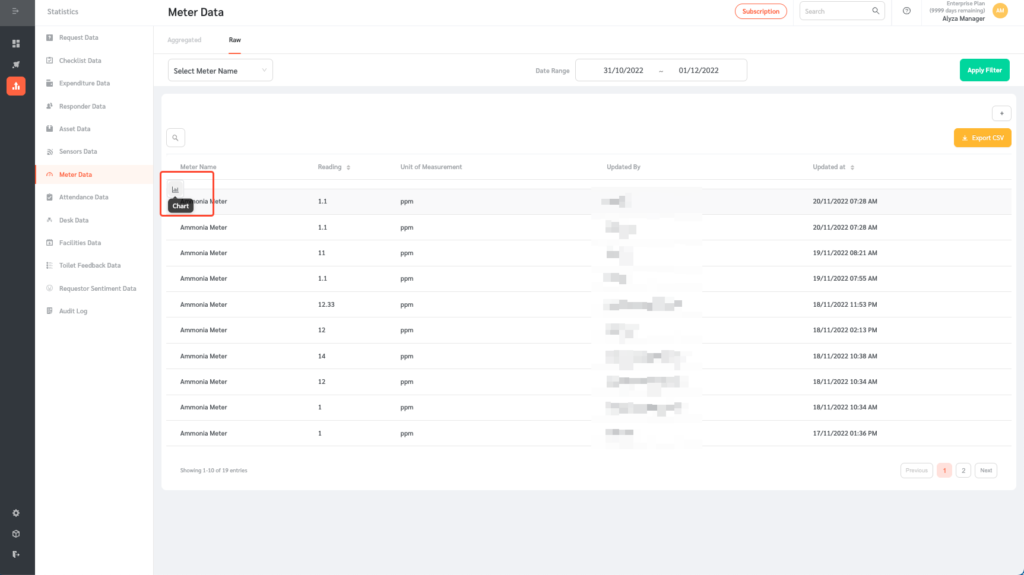
- You will be able to see the meter chart.
- You can filter the data by date range. Once the filter is set, click on Apply Filter.
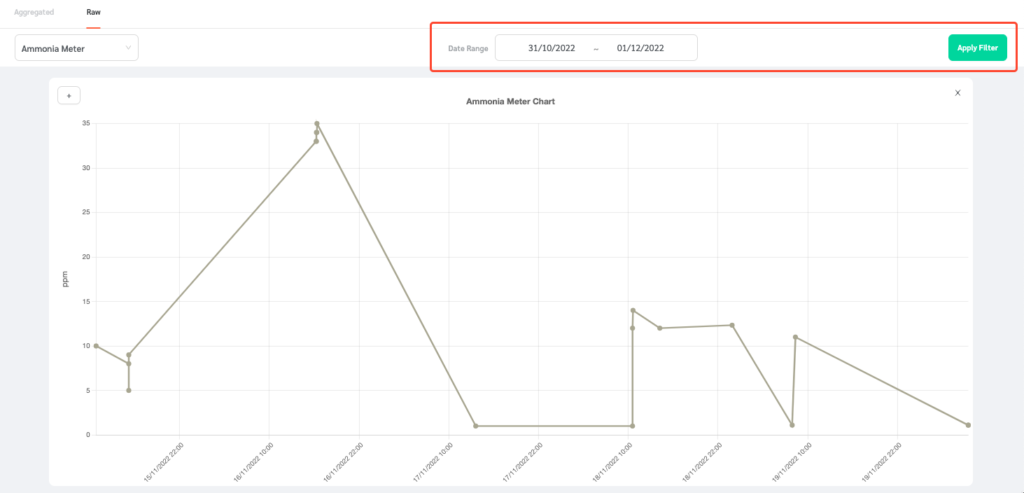
- You can also view other meter charts by selecting a meter on the dropdown menu which can be found on the top left.