The Toilet data charts and tables aggregate the toilet feedback received from requestors.
- To access this data, log in to FacilityBot Portal. Click on Statistics then Toilet Data.
- This data can be filtered by Date Range.
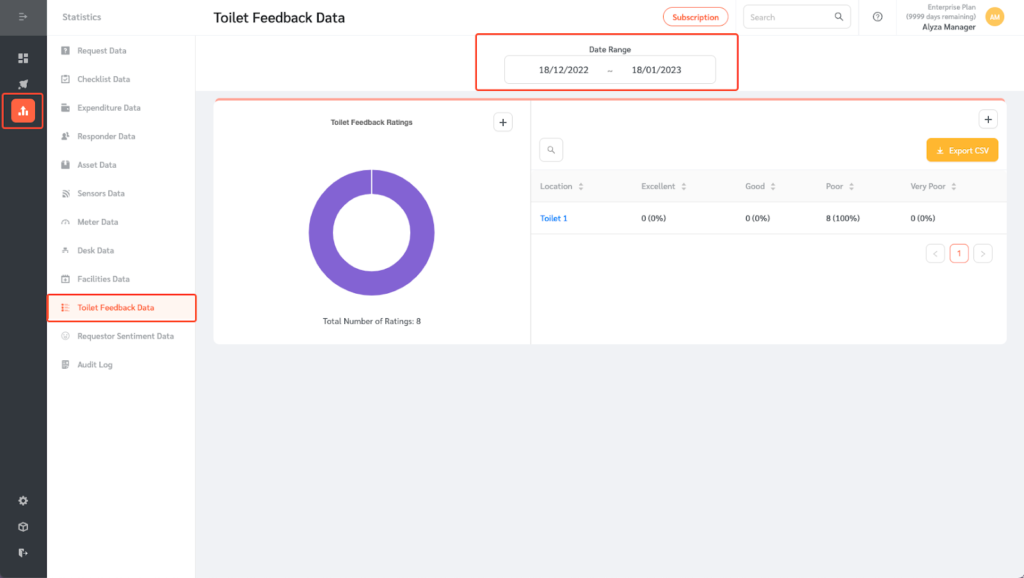
- The Toilet Feedback chart is shown on the left and a table view is shown on the right.
- Use the search field to search for a specific Responder.
- The table can also be exported as a CSV file using the Export CSV button.
- Click on the Plus icon to add the table to a custom dashboard.
