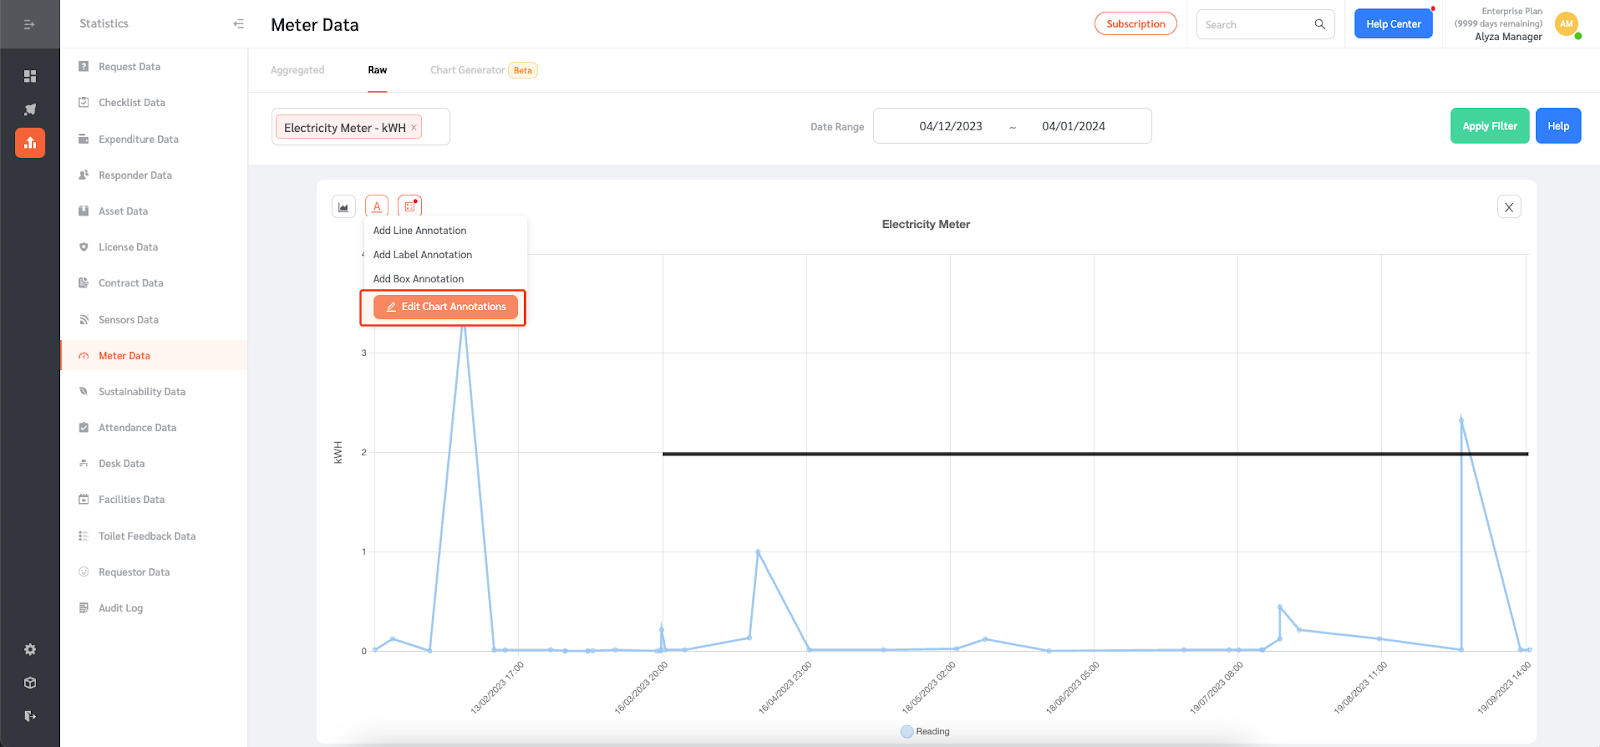
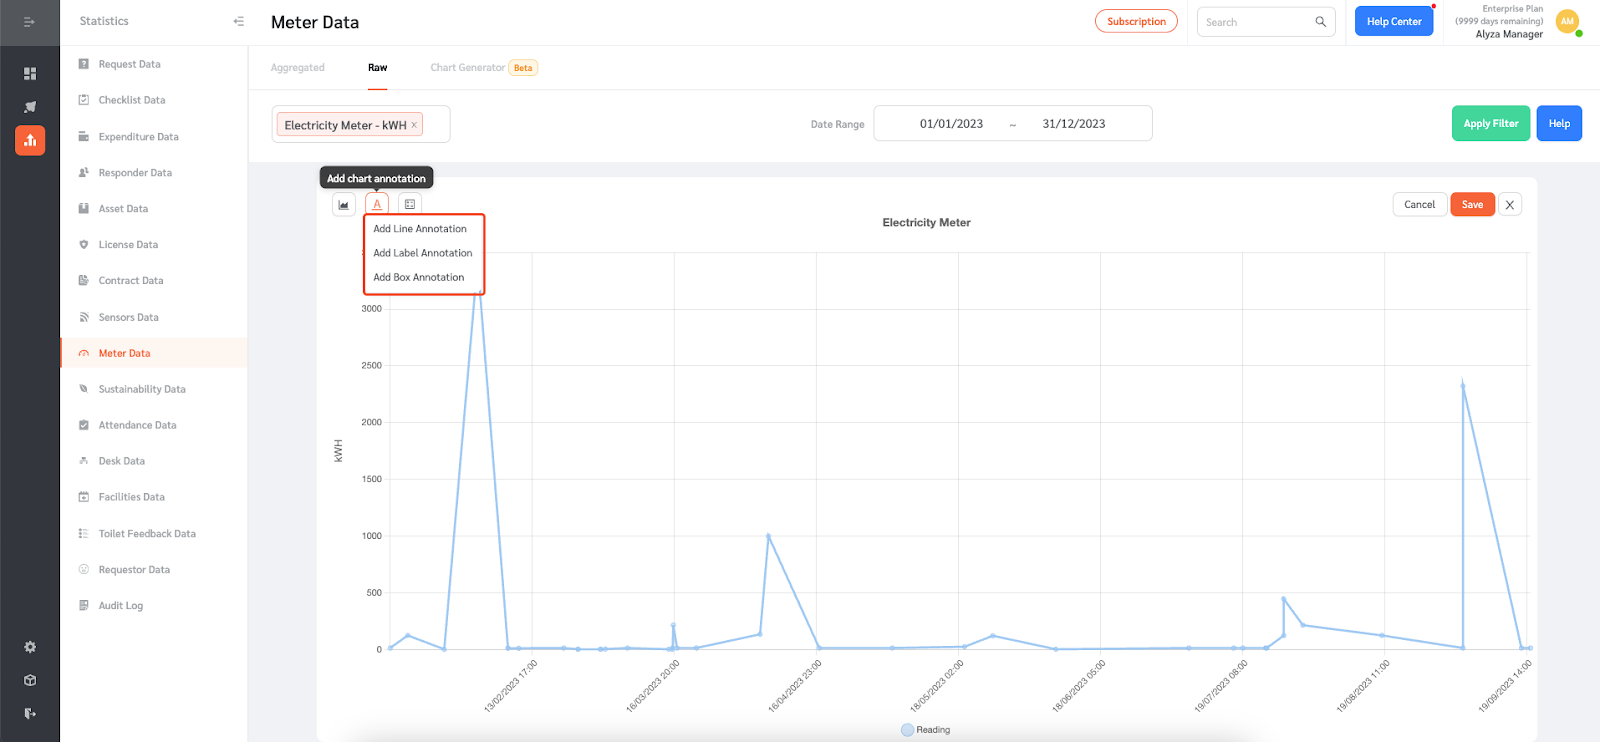
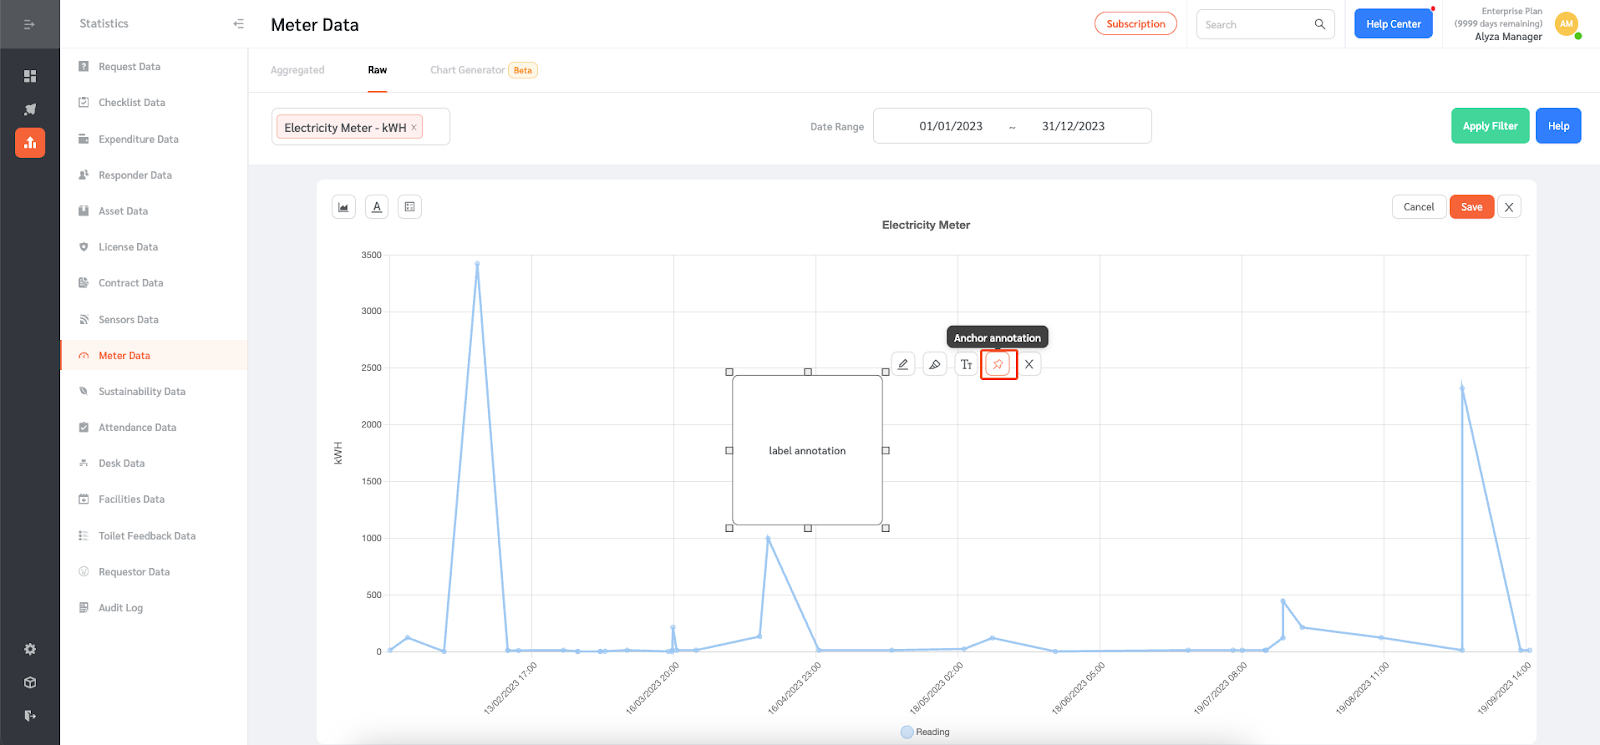
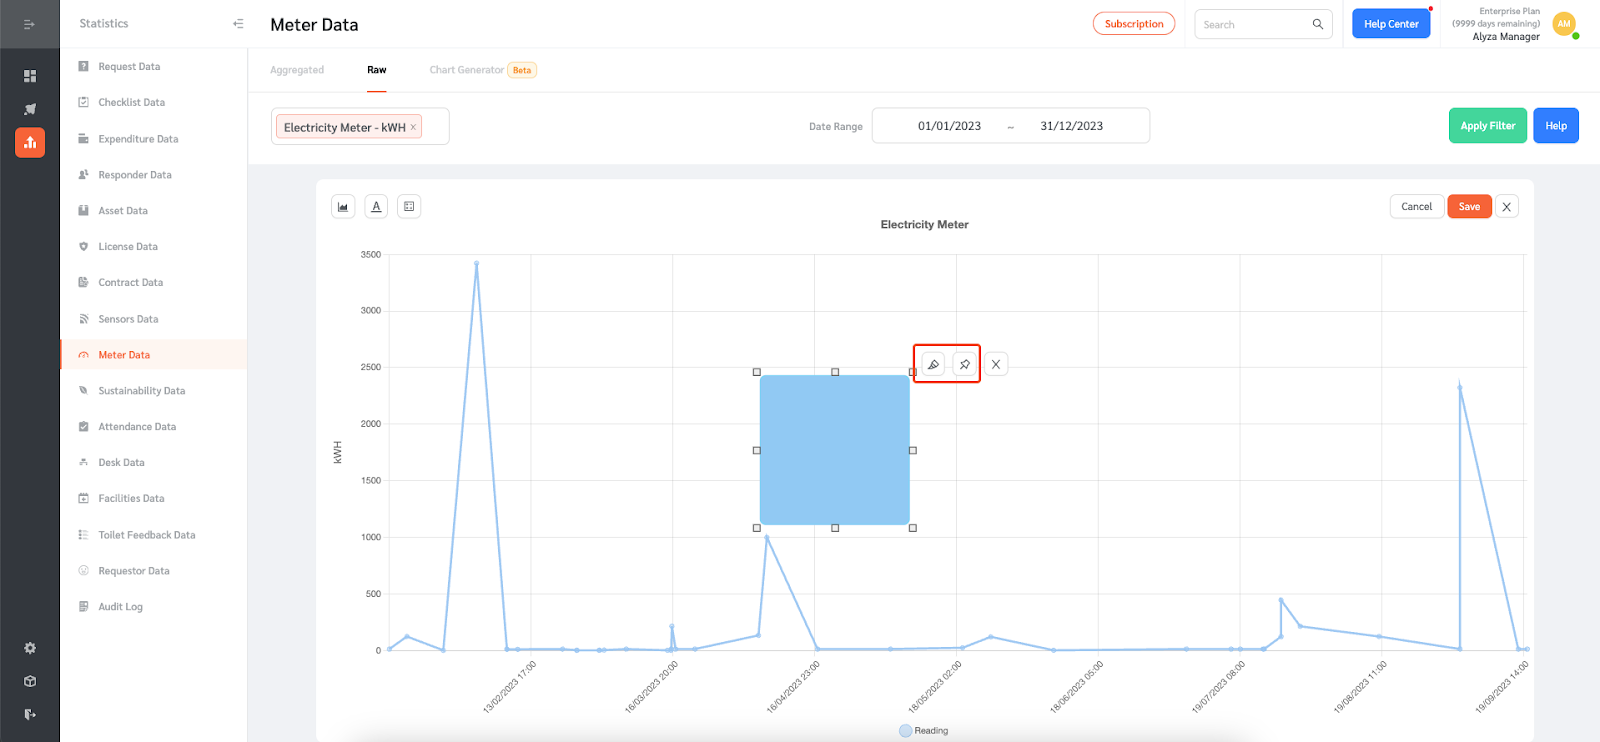
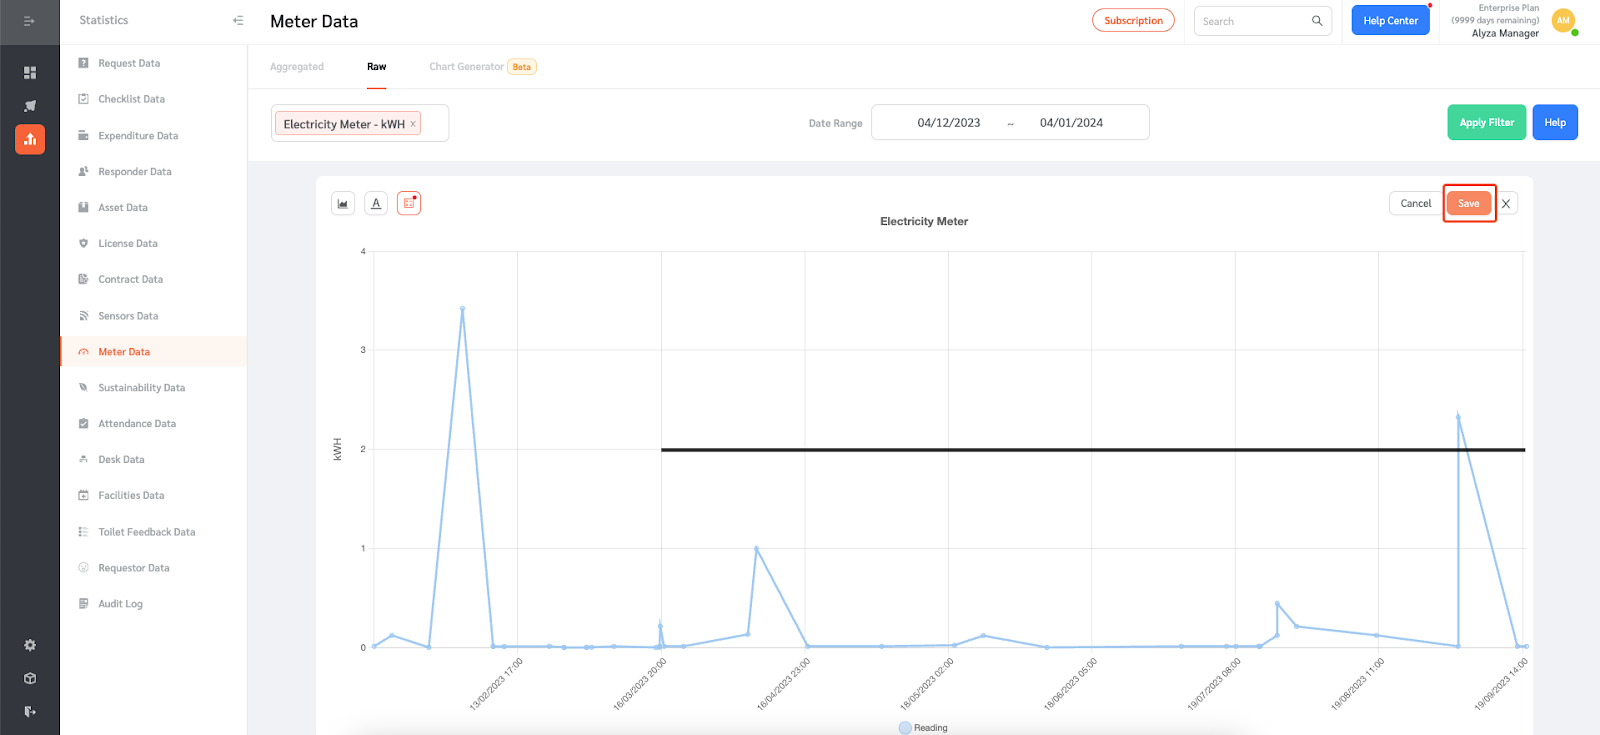
FacilityBot allows managers to add annotations to the Meter Charts. Managers can add line, label, or box annotations. Annotations may be useful for adding comments or indicating threshold values.
Adding Annotation to the Meter Charts
- Log in to FacilityBot Web Portal.
- Go to Statistics→Meter Data. Alternatively, you can go to Features→Meters.
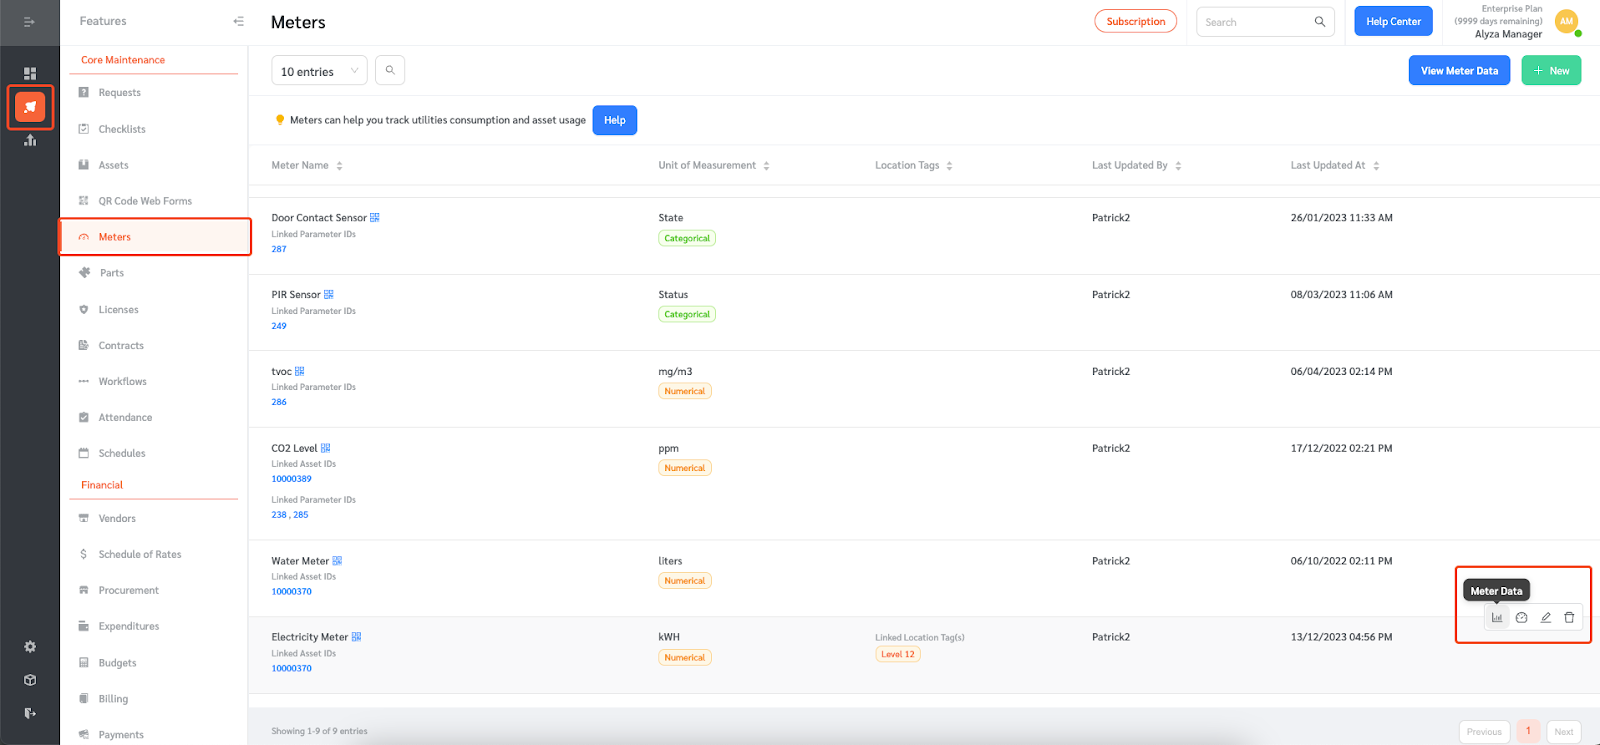
- Select the meter whose chart you want to add the annotation to.
- Click on the annotation icon to add annotations to the chart.
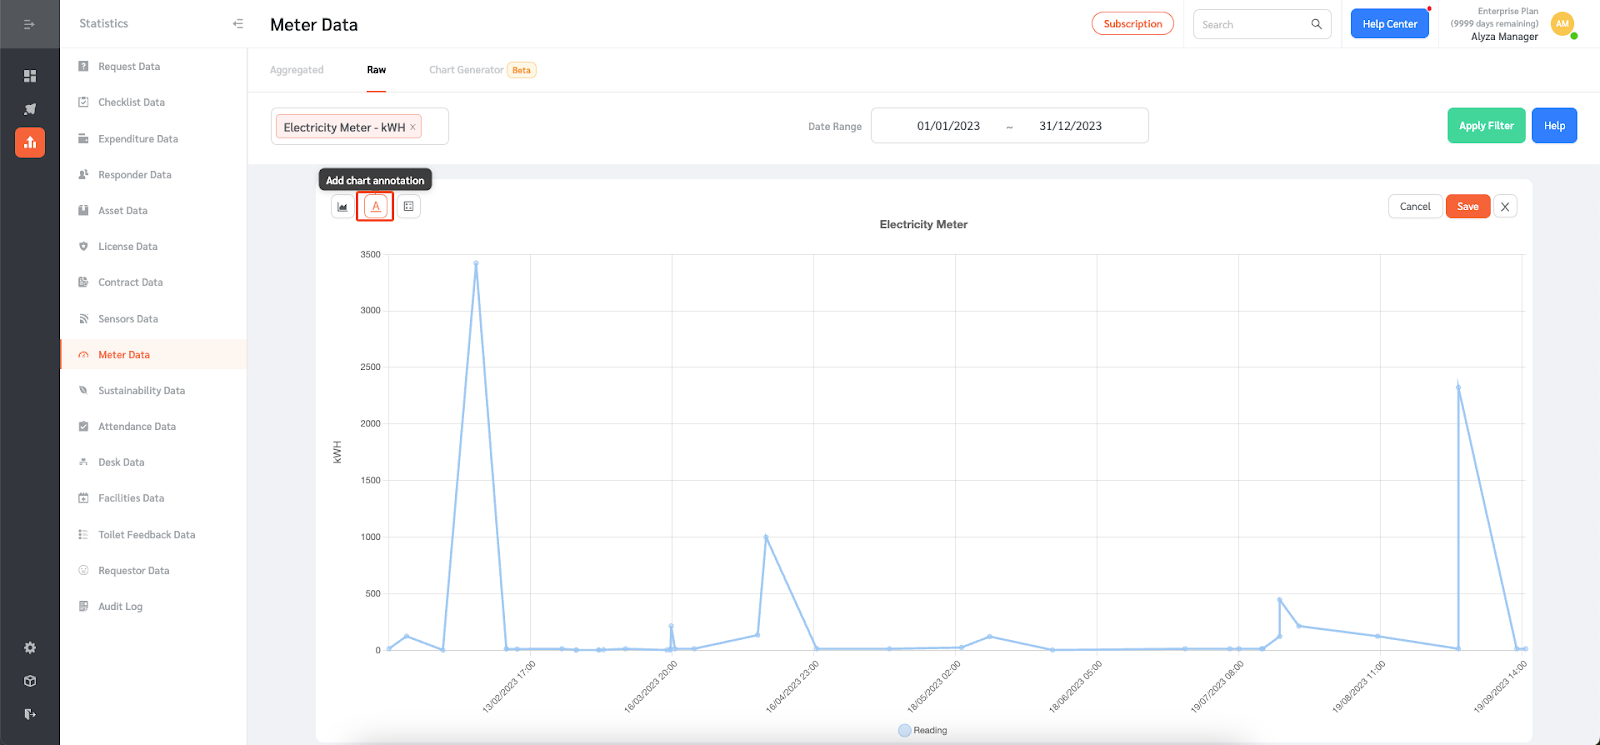
- FacilityBot gives you the option to add line, label, or box annotations.
- For the line annotation, you can select the color.
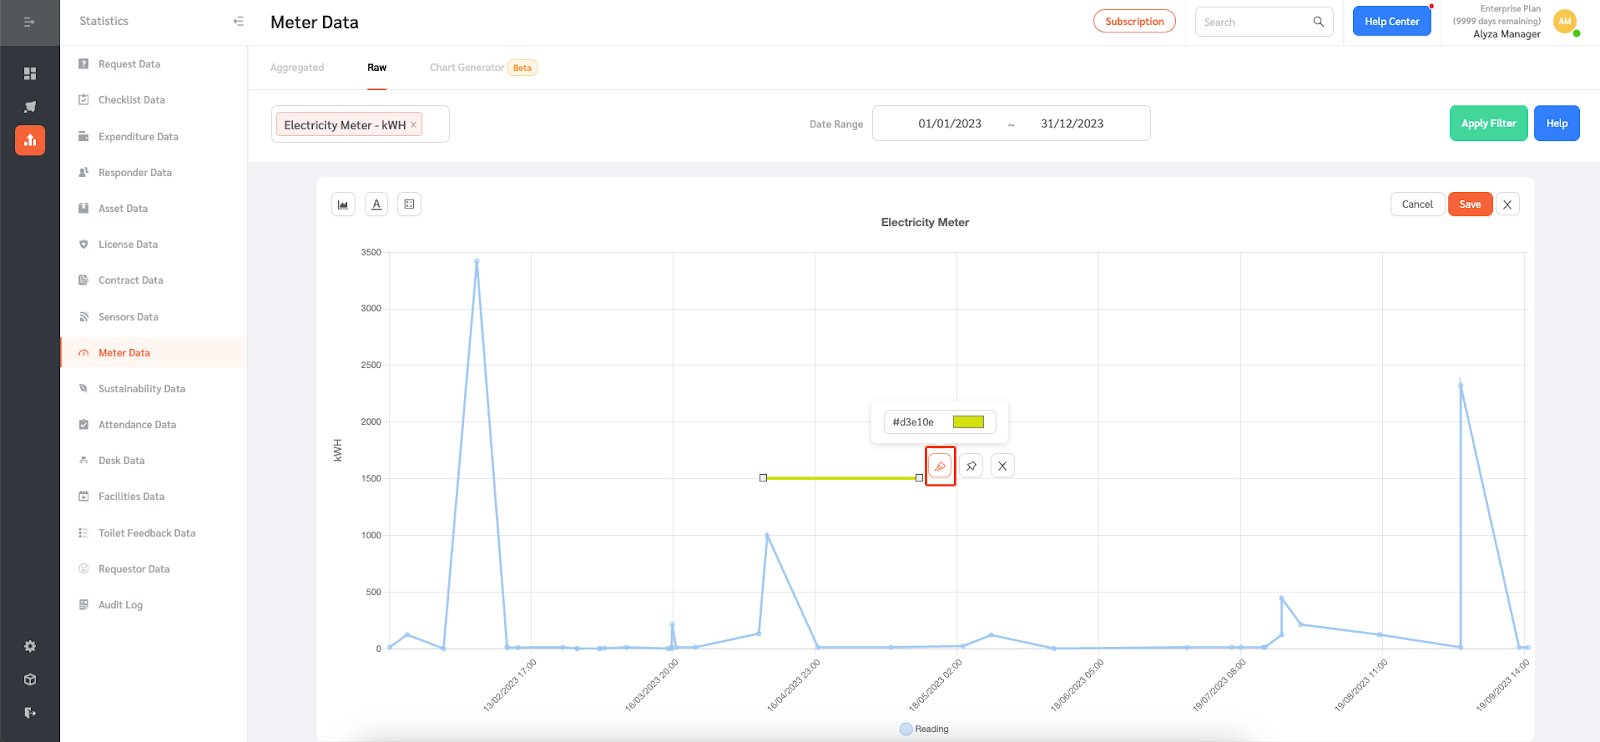
- You can also anchor the annotation.
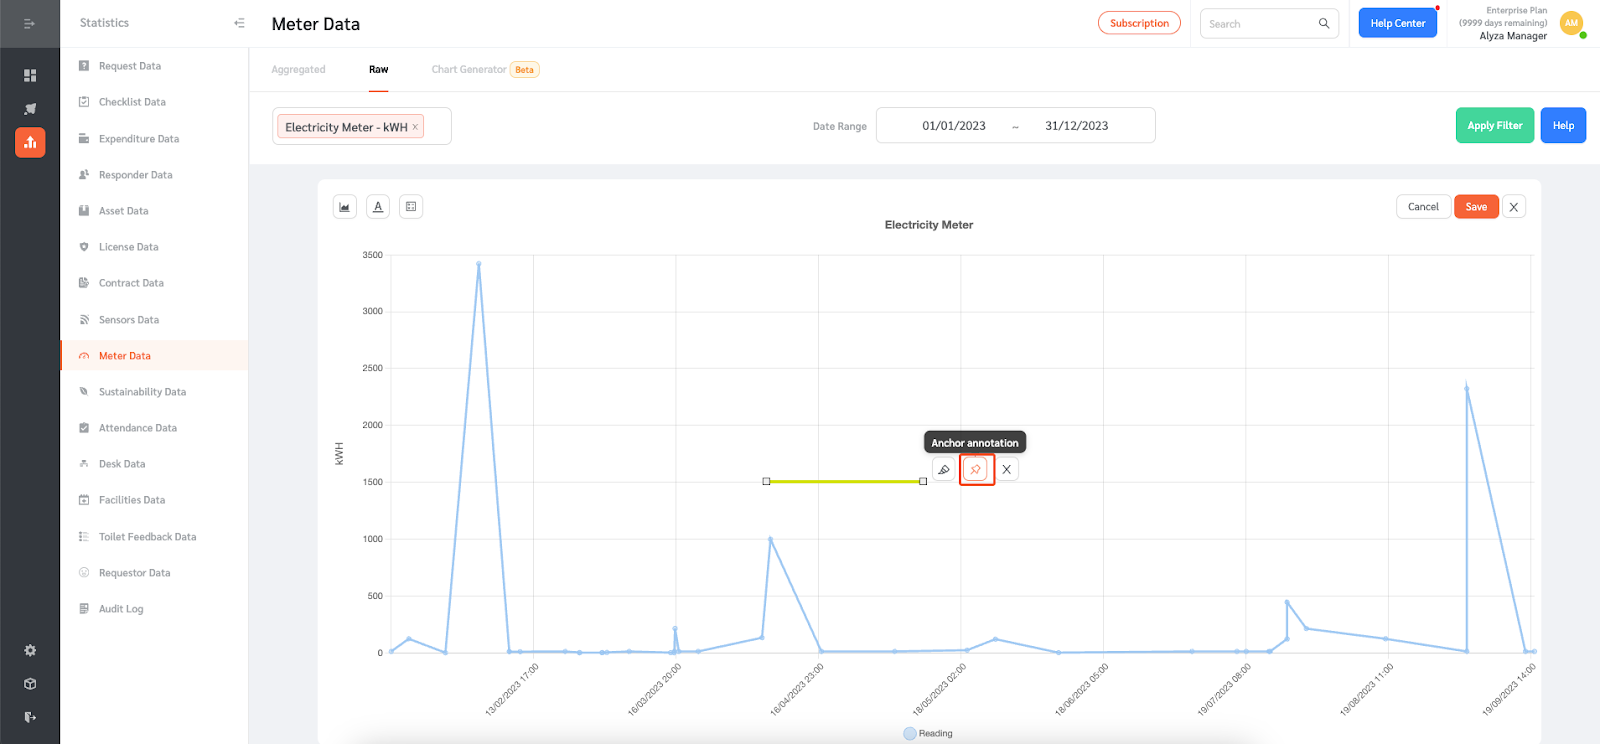
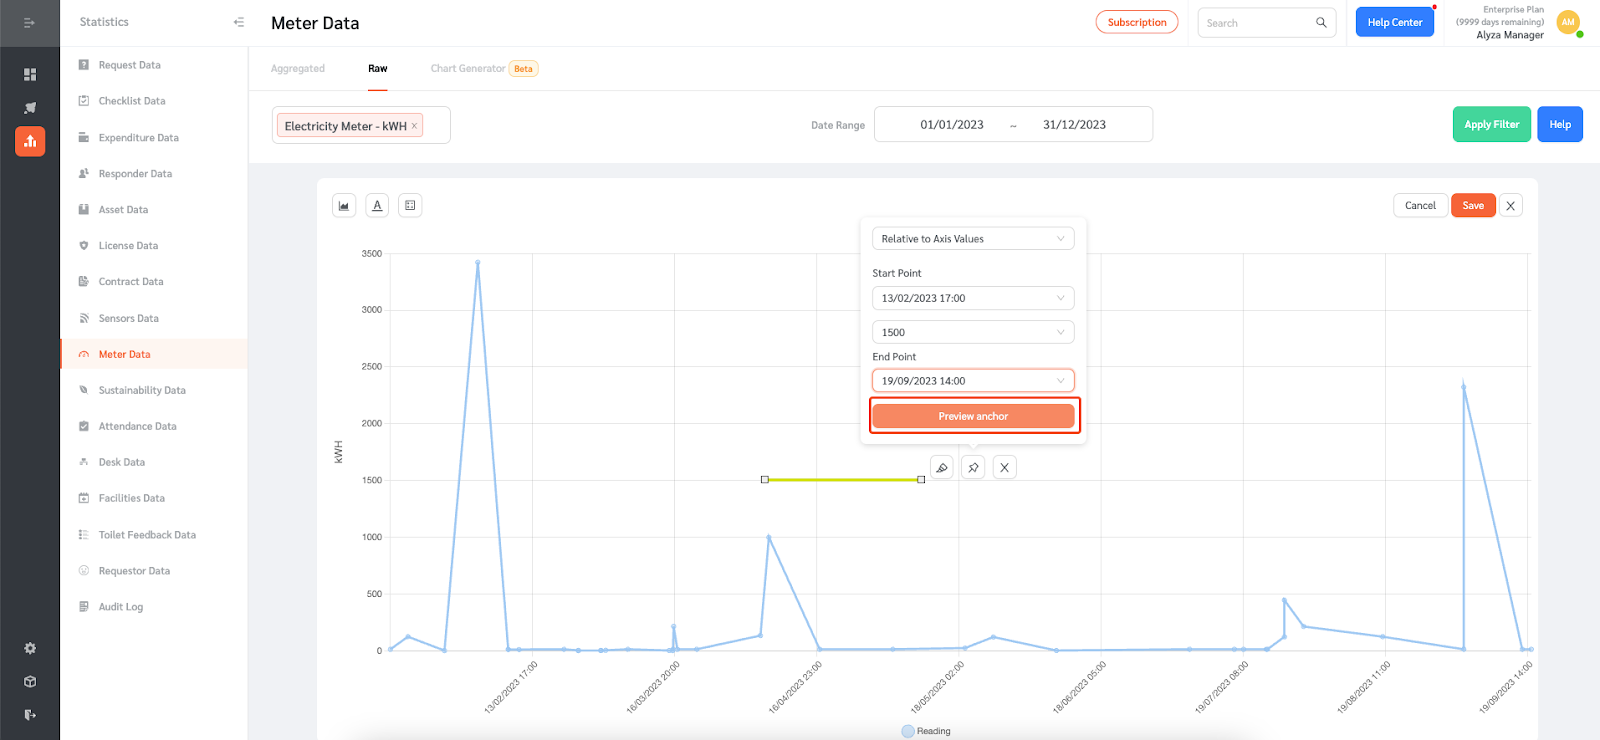
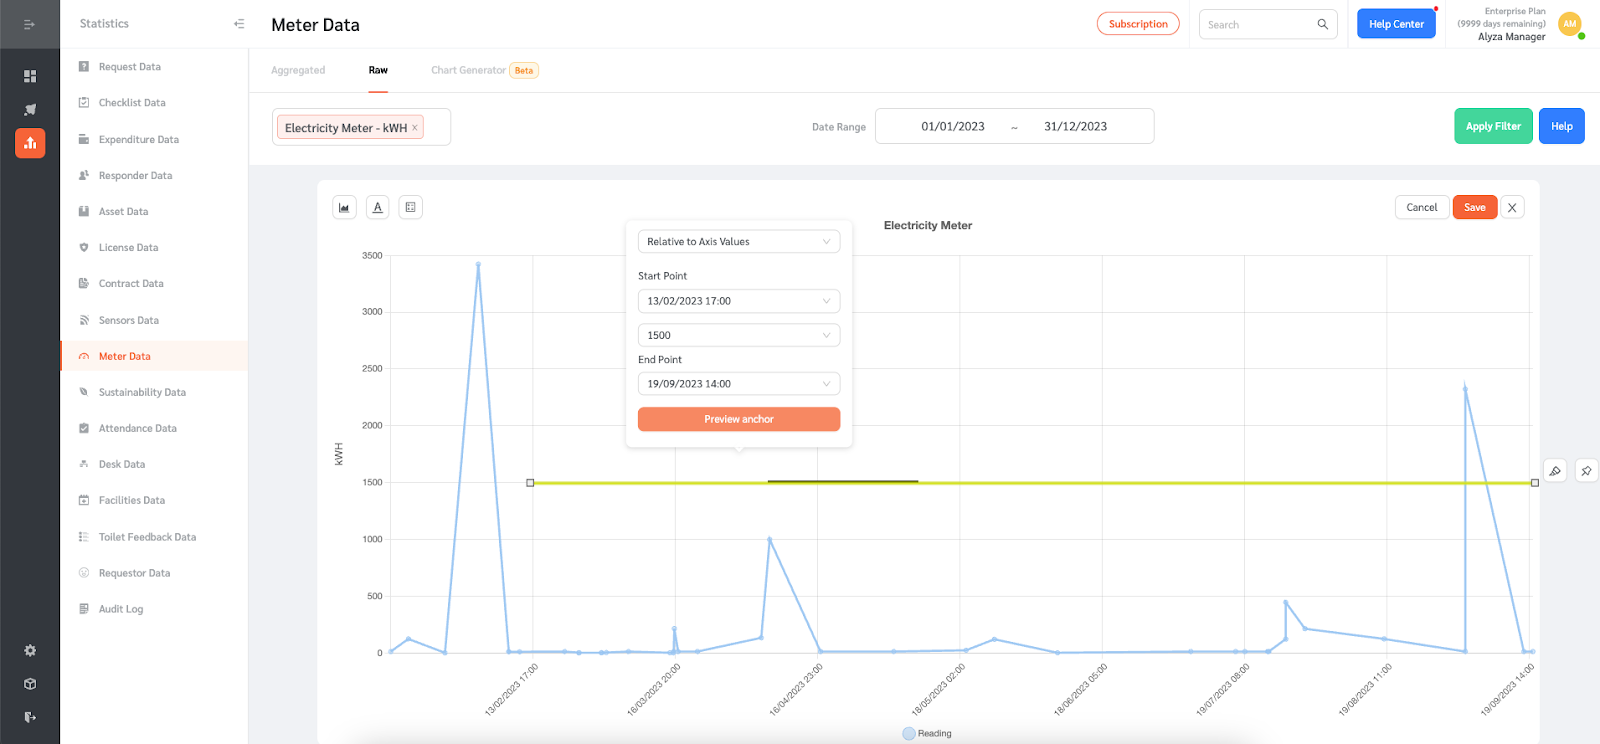
- You can anchor the annotation relative to the chart or the axis values.
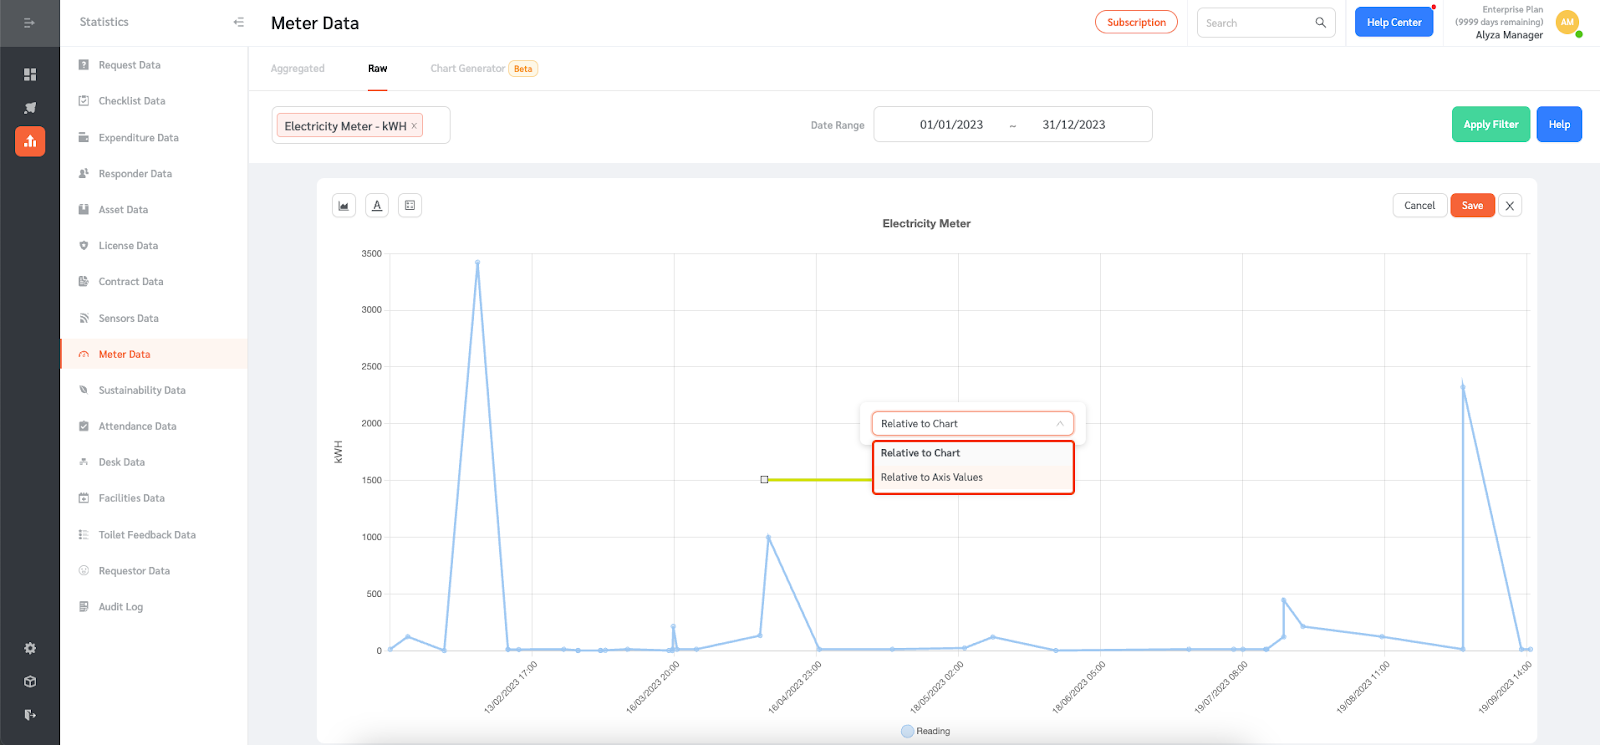
- You can select the start point and end point when anchor ‘relative to axis values’ is selected. Anchoring the annotation to axis values means that even when new readings are added, the position of the line in the chart will remain unchanged relative to the axis values.
- Click ‘Preview Anchor’ to view the annotation.
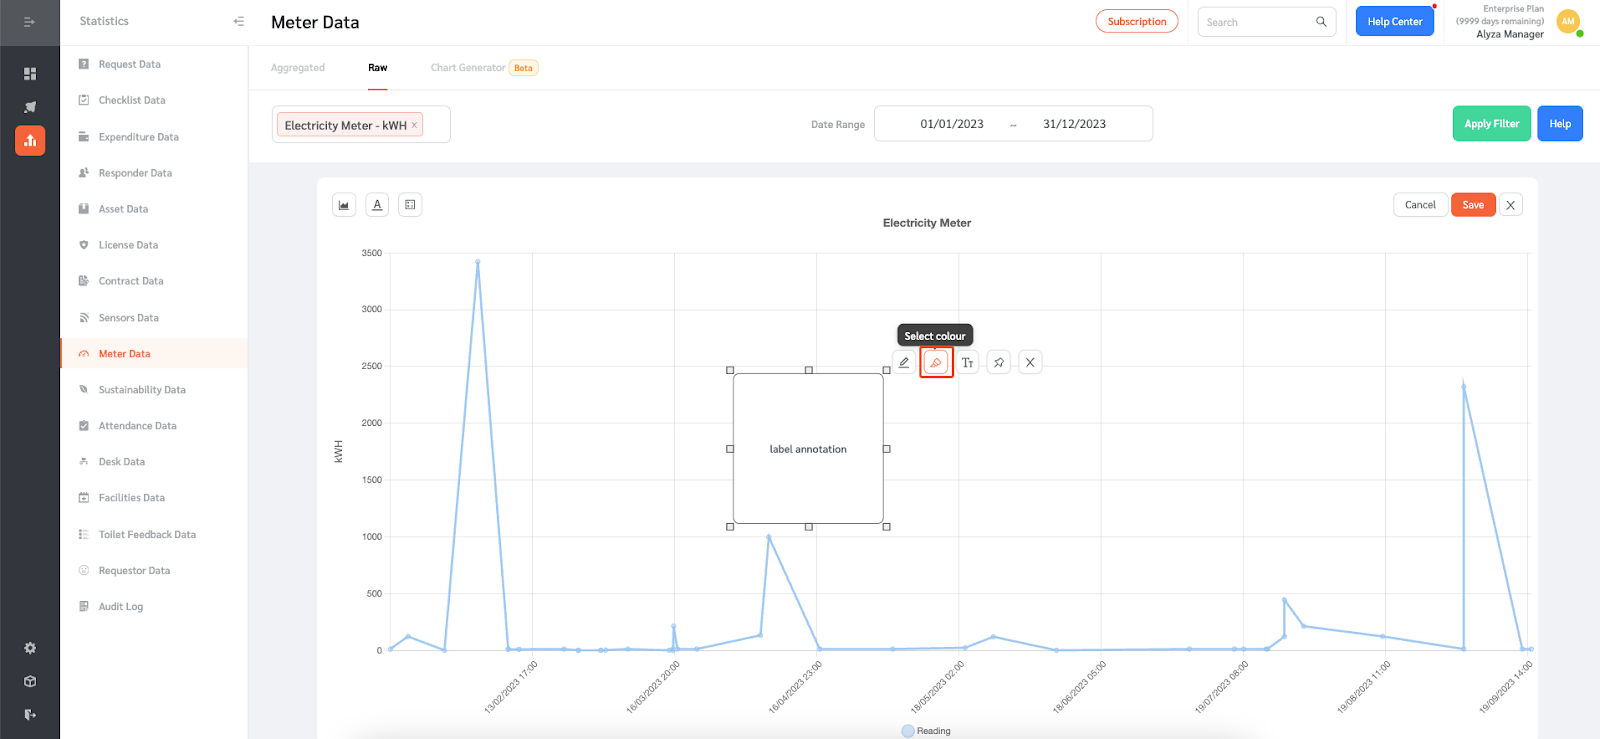
- For the label annotation, click on the box to show other actions that can be taken.
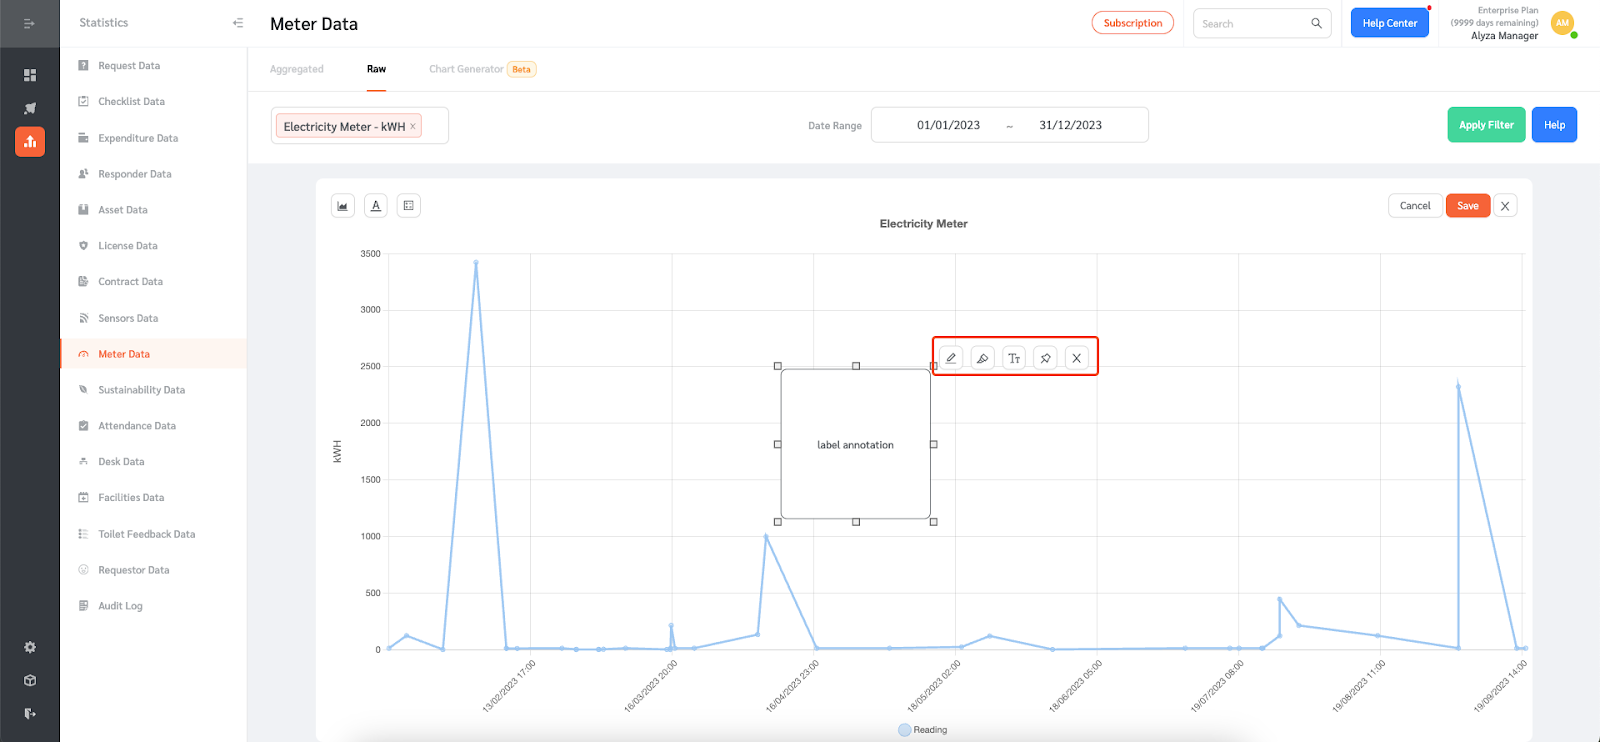
- You can add text and select the color of the text.

- You can also change the color of the text box.
- The annotation can also be anchored relative to the chart or the axis values.
- You can also anchor the box annotation relative to the chart or the axis values. The color of the box can also be changed.
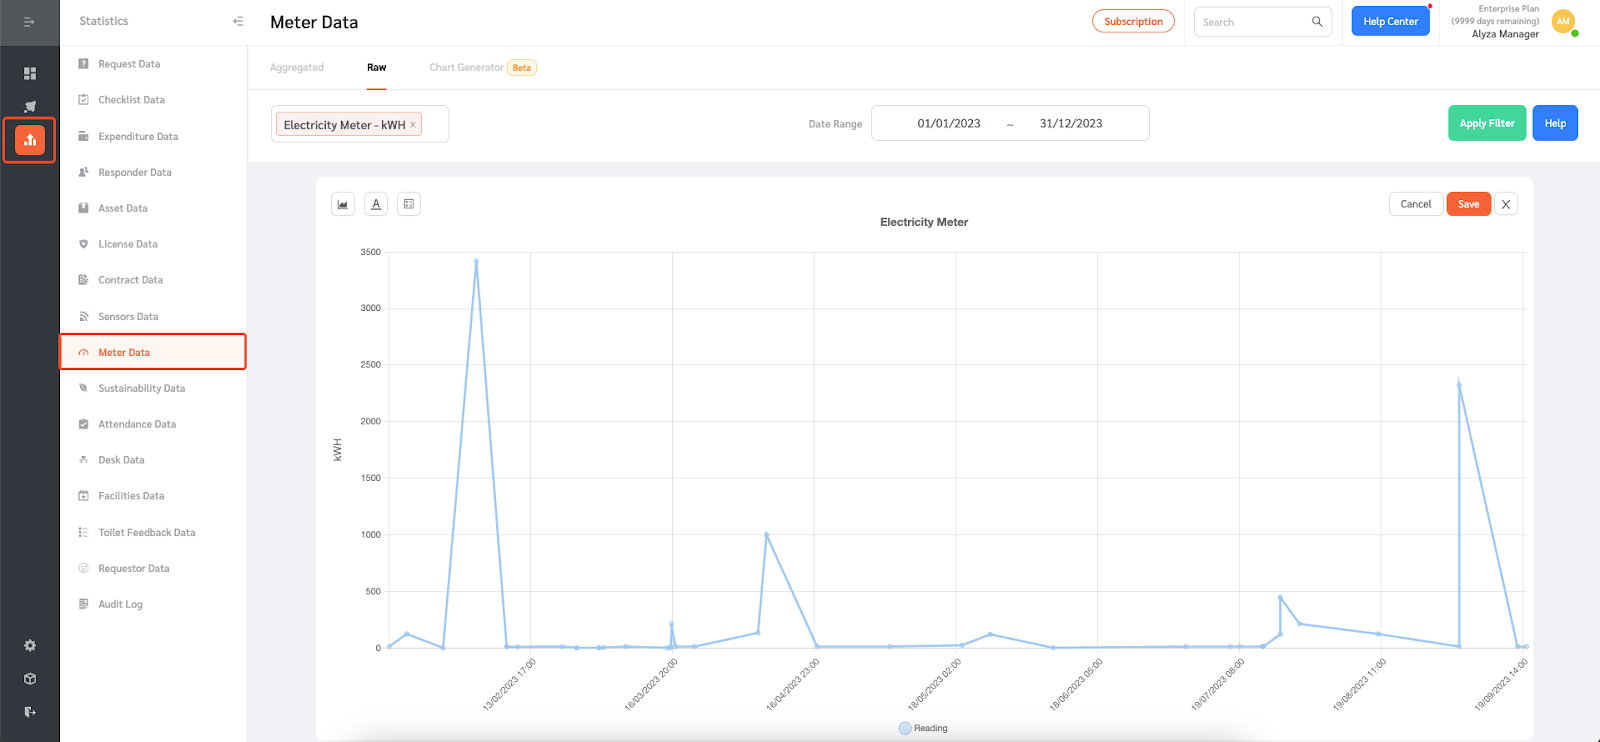
- Once done, click `Save` to save the annotations.
- If you need to edit the annotations, click on `Edit Chart Annotations` to go into Edit Mode.