The Expenditure Data charts and tables aggregate the expenditures incurred in all linked instances.
- Click on Statistics then Expenditure Data.
- The data can be filtered using a date range.

- Expenditures are broken down by Location Tag, Request/Fault Type, and SOR Name.
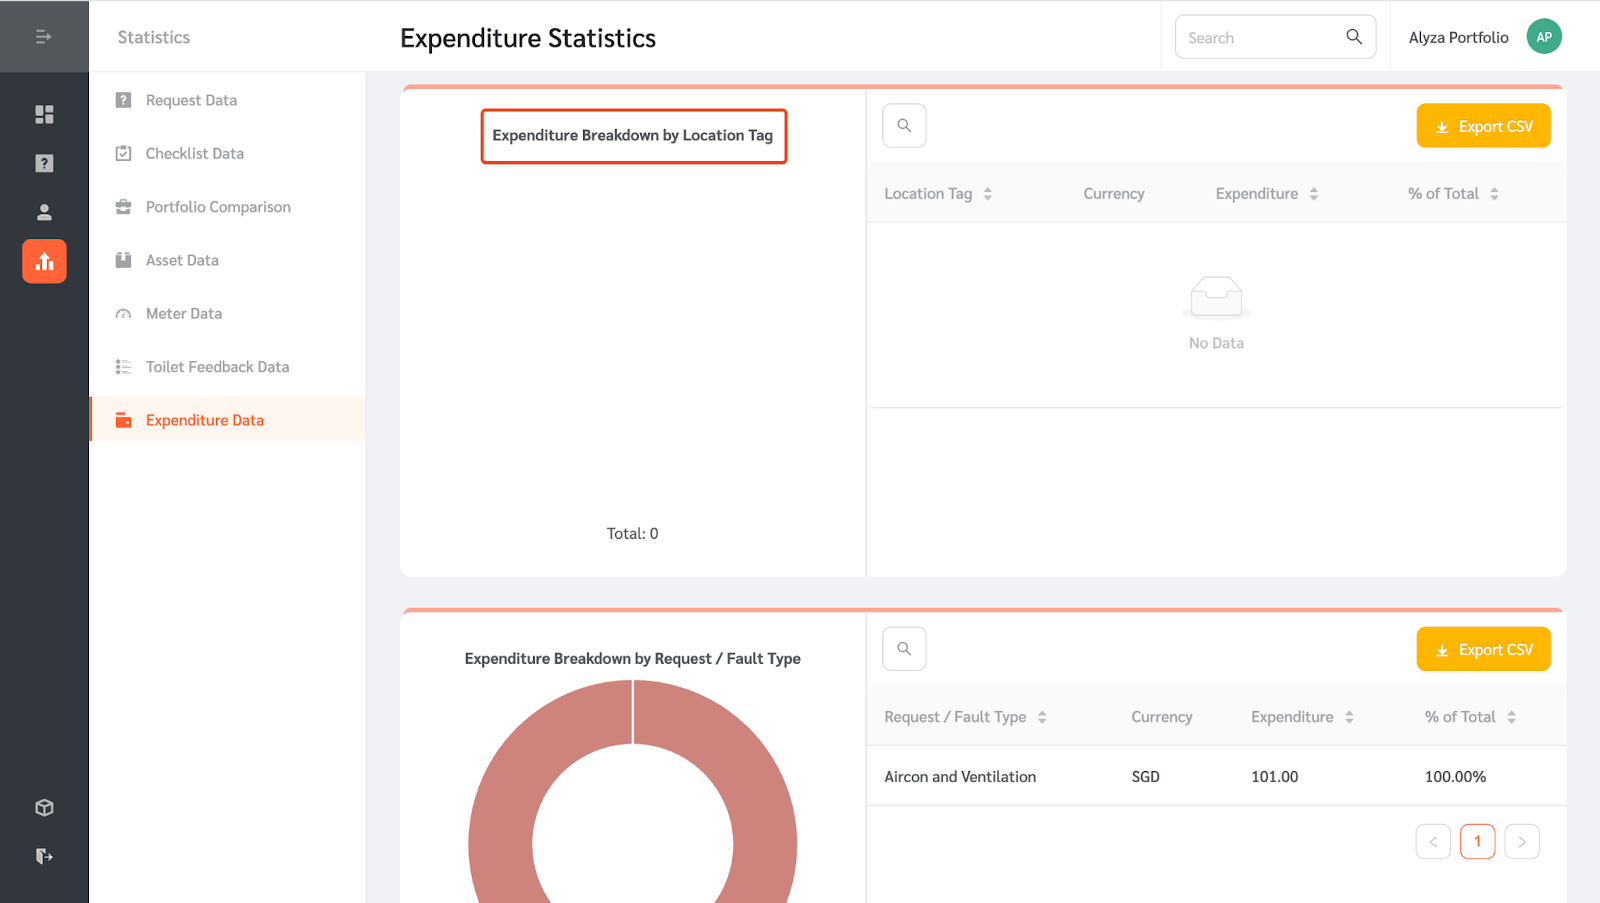
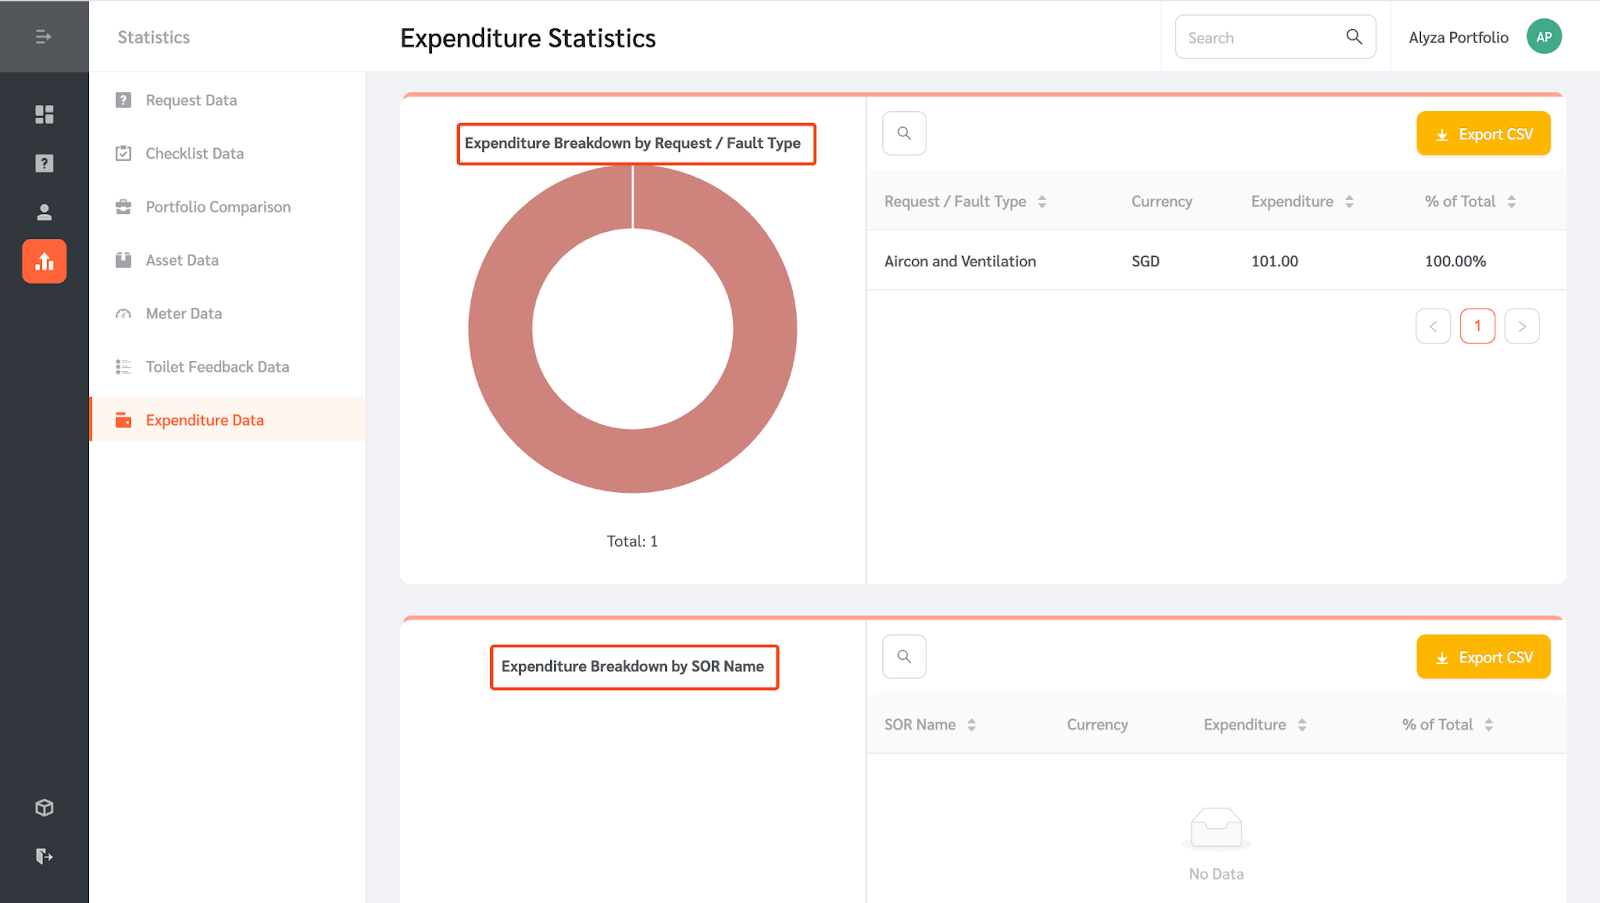
- The left-hand side shows the pie chart and the table view is shown on the right.
