FacilityBot’s Analytics Dashboard is customizable to fit with your organization’s reporting preferences. Whether you are structuring data, arranging widgets, or improving readability, our flexible layout and visualization tools empower you to design dashboards that work best for you.
To create an Analytics Dashboard:
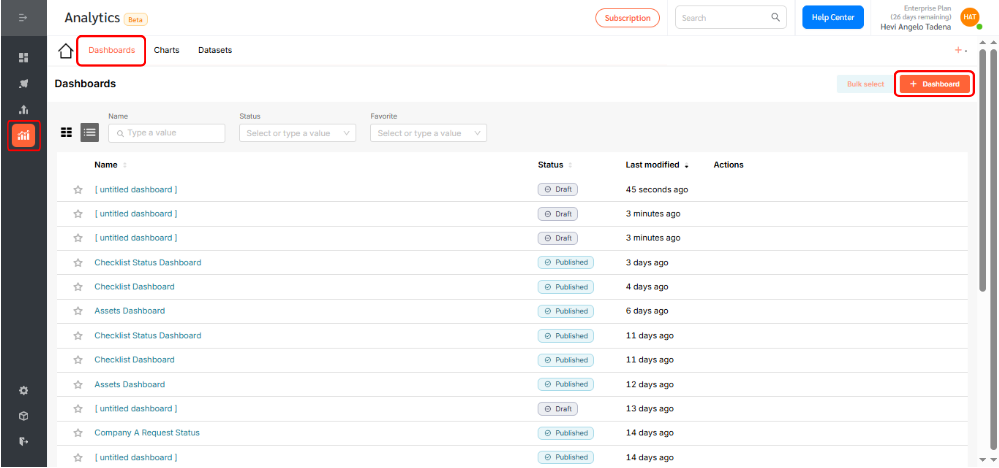
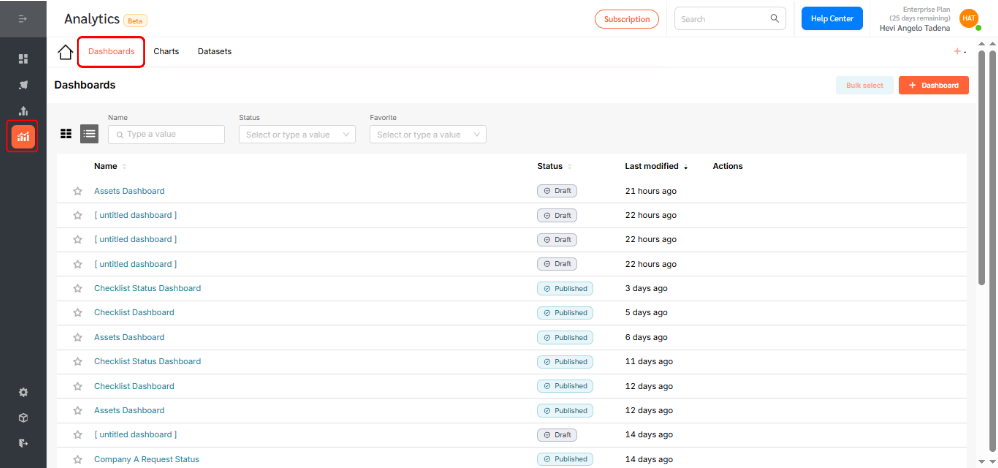
- Go to Analytics, then Dashboards, then click + Dashboard
- Rename your dashboard and mark it as a favorite by clicking the ⭐ star icon.
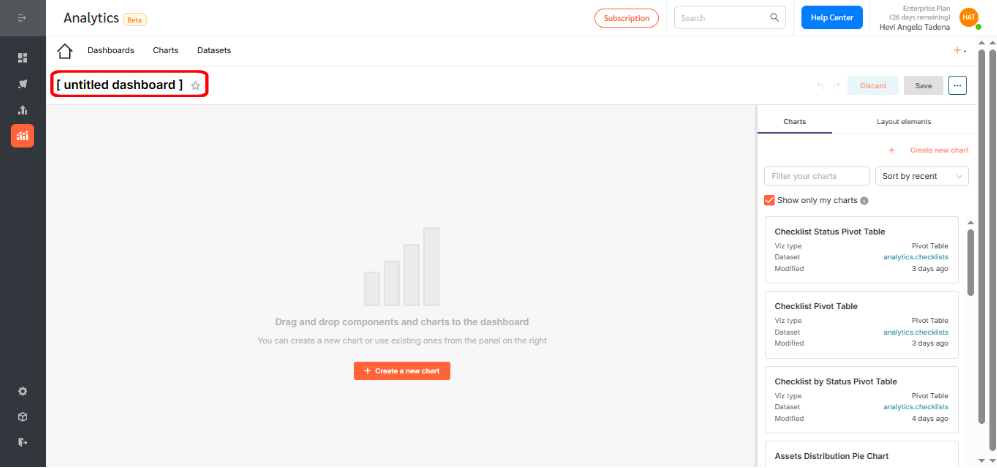
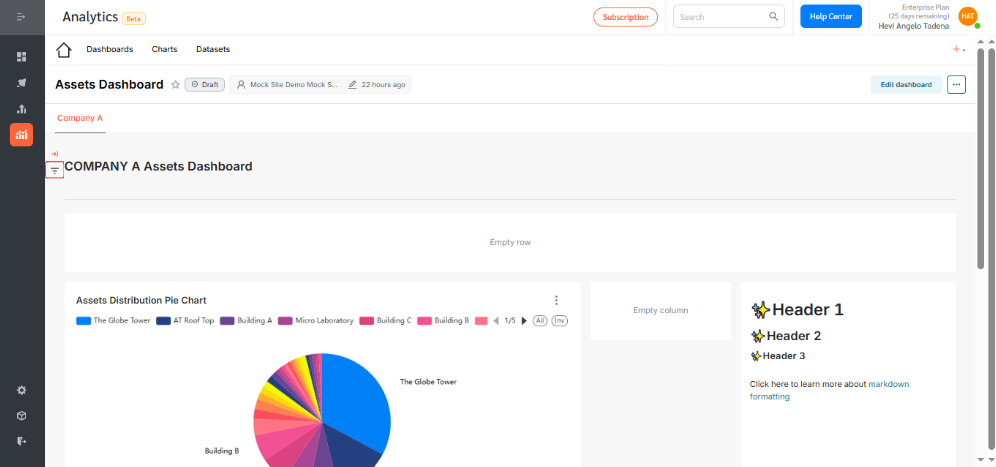
- Drag and drop charts directly into your dashboard.
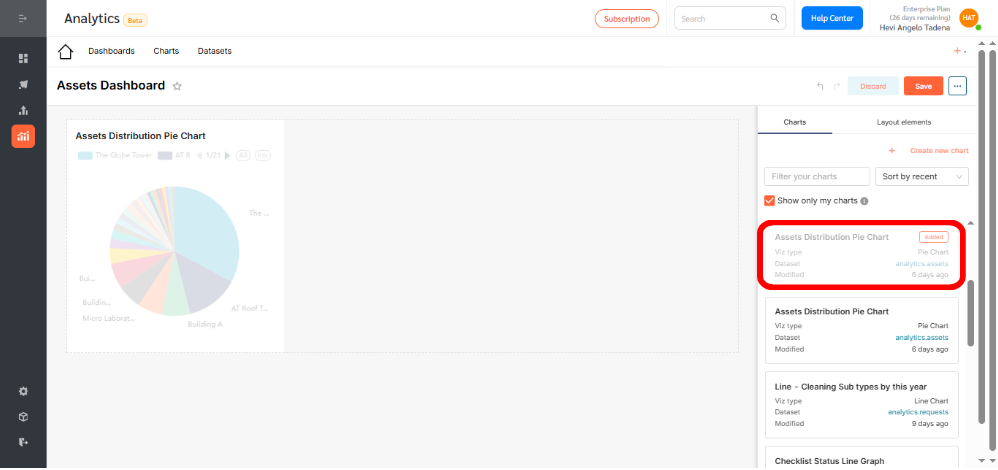
- Resize charts to suit your layout preferences.
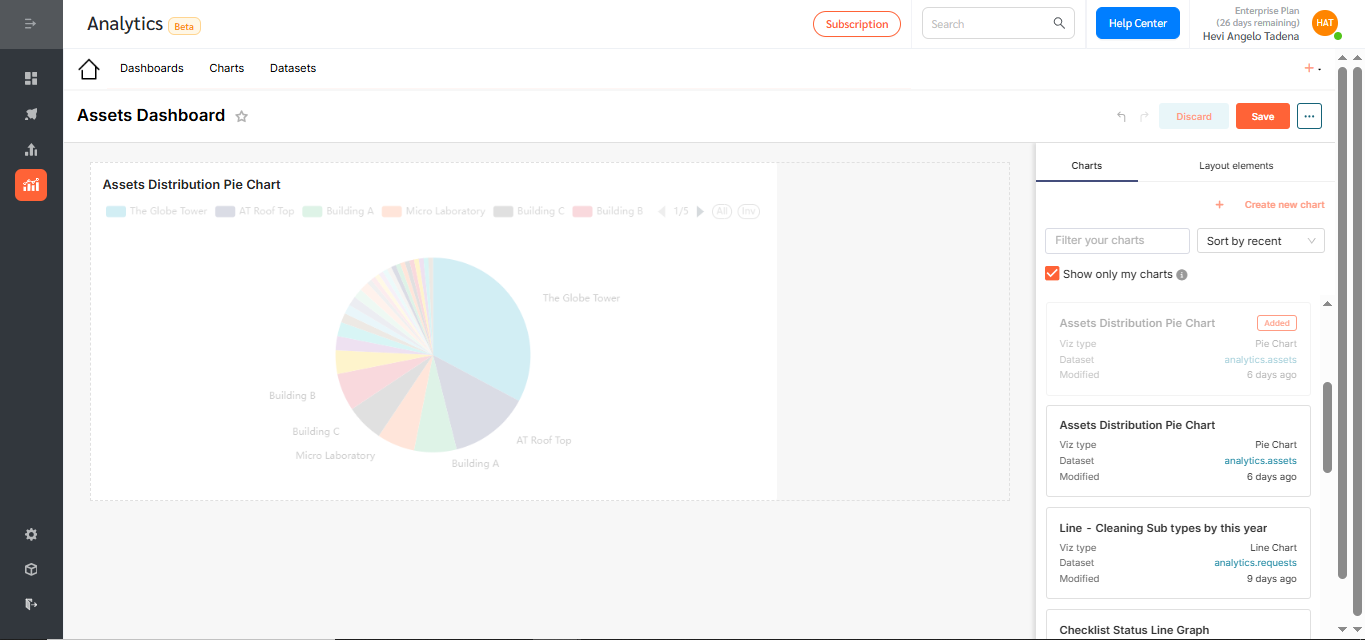
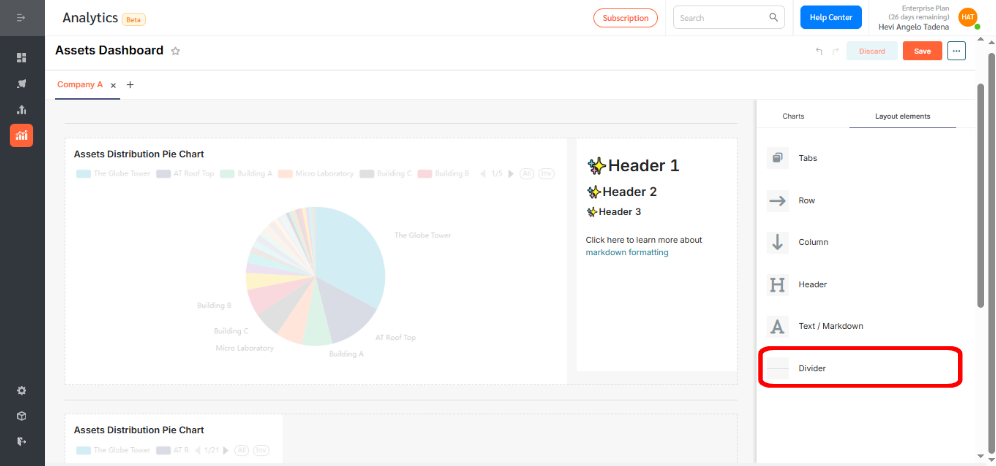
- Click Layout Elements to add structure and context to your dashboard.
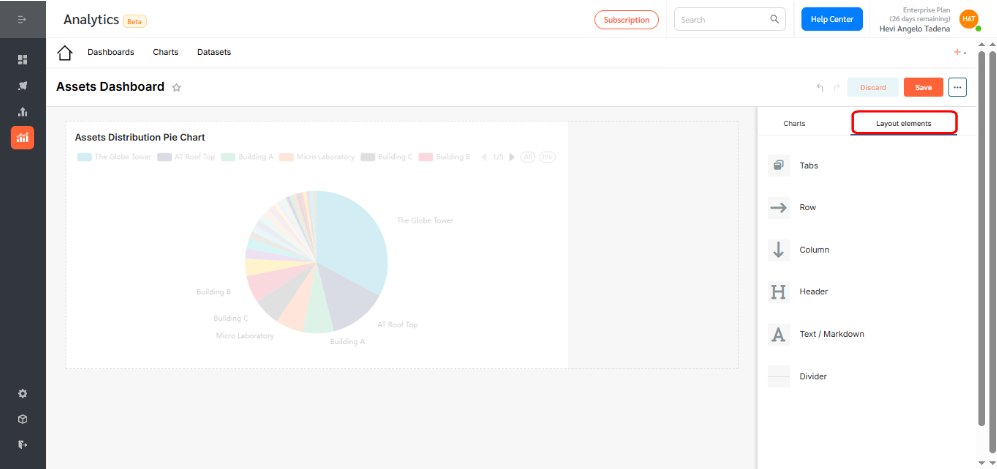
- Here, you can drag and drop layout elements to organize your dashboard content. Available elements include:
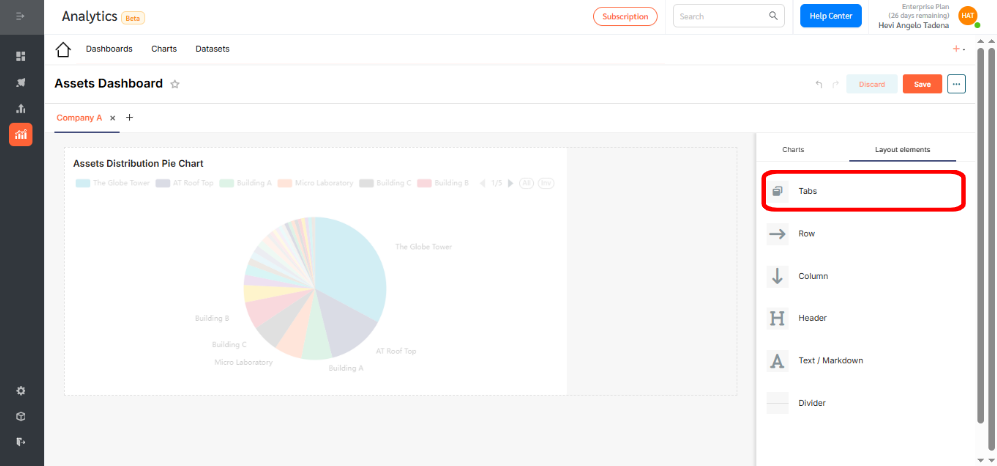
📁 Tabs
- Organize content into easily navigable sections or modules.
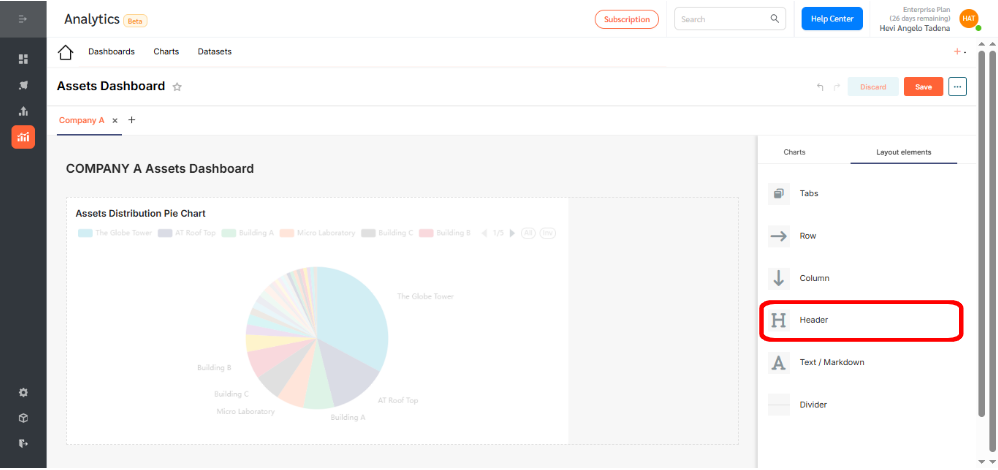
🔠 Header
- Add section titles for clarity and structure.
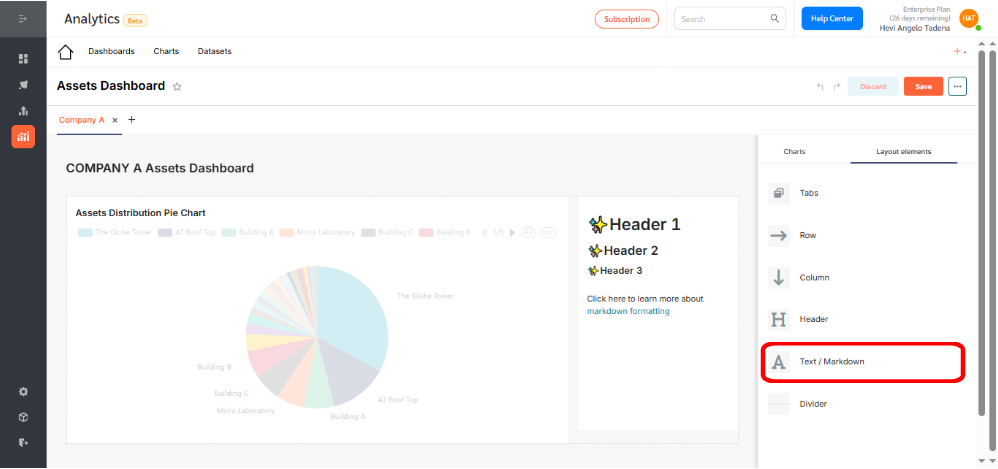
✍️ Text
- Insert plain text, HTML, or embedded content like links and images.
➕ Add Image via HTML
- Insert a Text element.
- Paste this code:
<img src=”https://your-image-url” width=”100%” height=”auto”>
➕ Add Image via Markdown
Use this syntax inside a Text element:

➕ Embedding Tables
FacilityBot supports basic HTML tables through Text elements. Example:
<table>
<tr>
<th>Zone</th><th>Status</th>
</tr>
<tr>
<td>Main Lobby</td><td>Operational</td>
</tr>
<tr>
<td>Meeting Room 2</td><td>Under Maintenance</td>
</tr>
</table>
➖ Divider
- Use lines or spacers to visually separate dashboard sections.
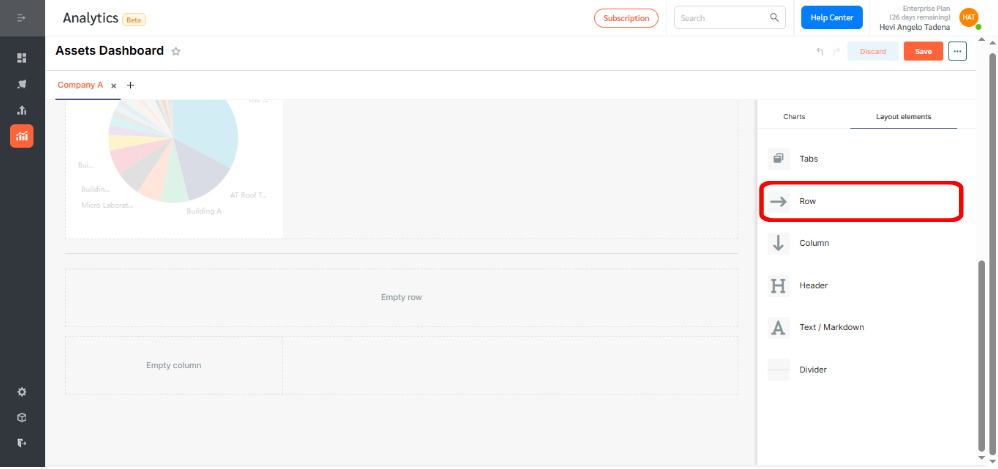
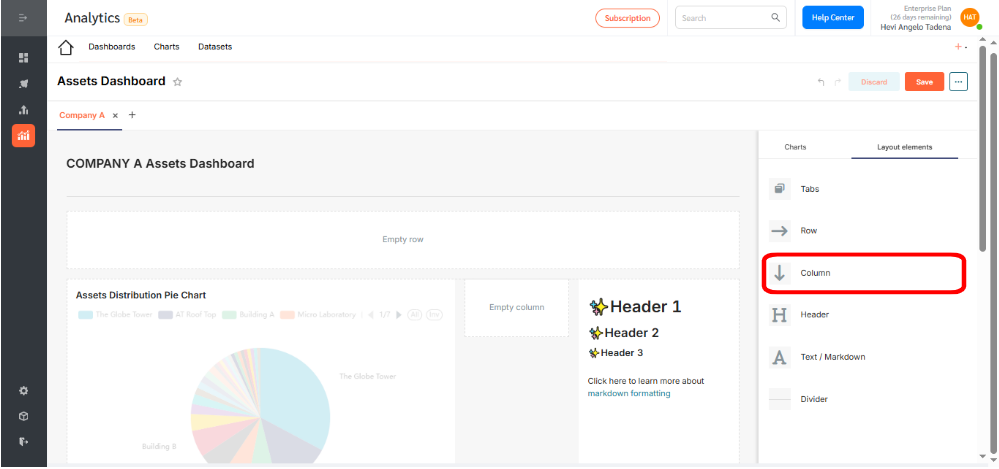
📦 Rows and Columns
- Create flexible grid layouts for charts, widgets, and tables.
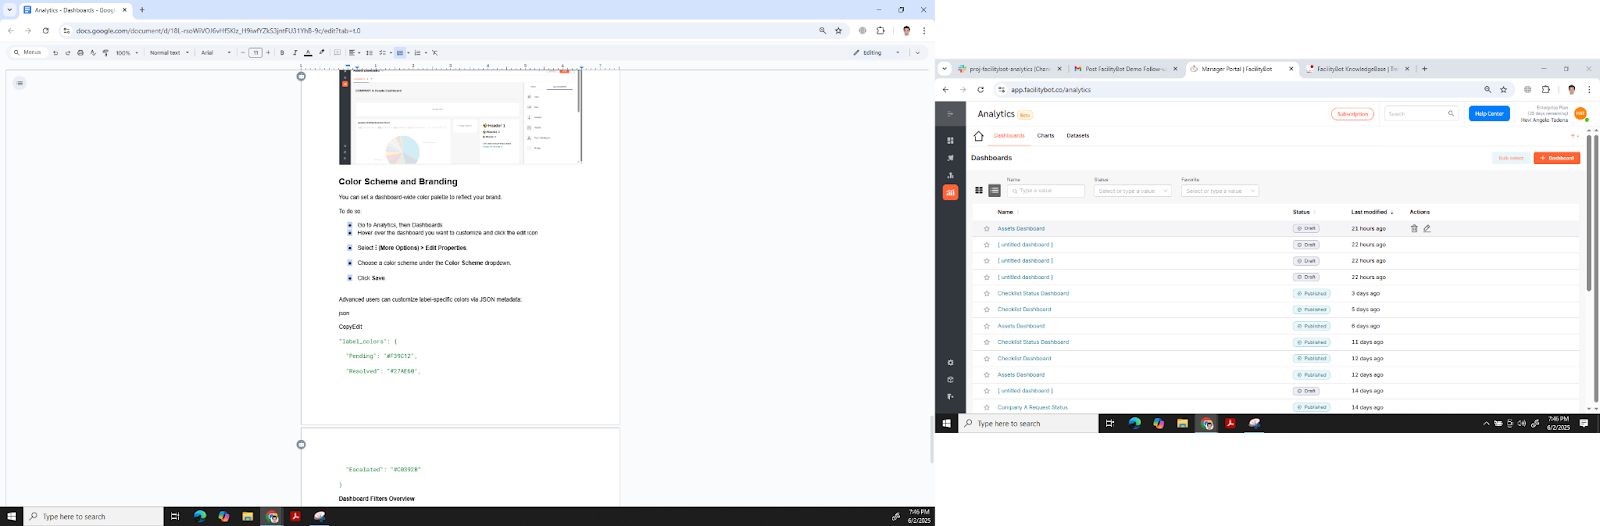
Color Scheme and Branding
You can set a dashboard-wide color palette to reflect your brand.
To do so:
- Go to Analytics, then Dashboards

- Hover over your desired dashboard and click the Edit icon.
Dashboard Filters
FacilityBot’s dashboard filters let you slice and dice your data with ease. Use the Filters sidebar to apply filters across all charts on a dashboard—no extra setup needed.
- Value filters let you choose specific values for any column.
- Numerical range filters help define data ranges, like costs or dates.
- Time-based filters (like Time Range and Time Grain) allow for powerful time-specific insights.
To enable this feature:
- Go to Analytics, then Dashboards
- Hover over the desired dashboard and click Edit.
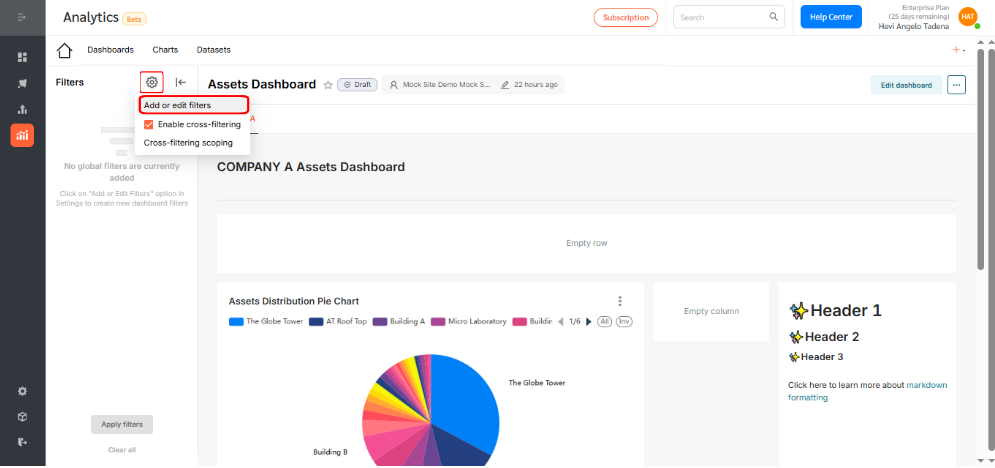
- Click the Filter icon on the left side.
- Click the Settings icon to add or edit filters.
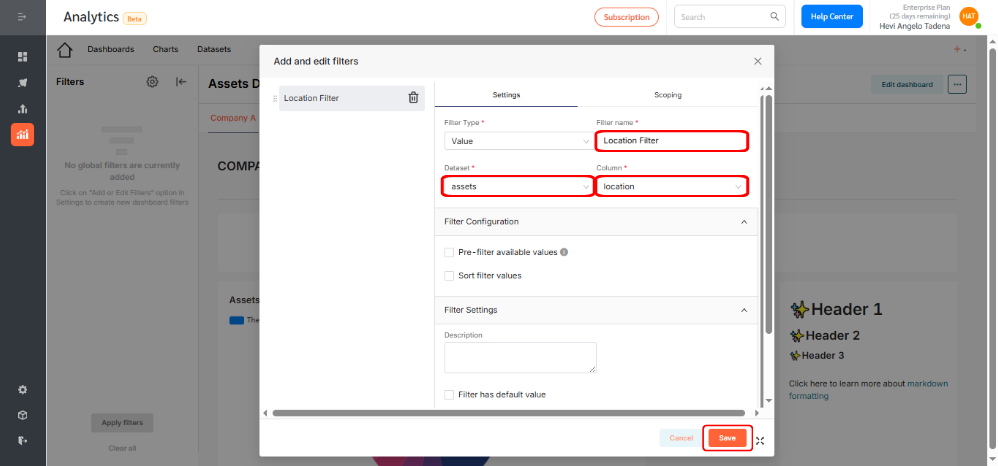
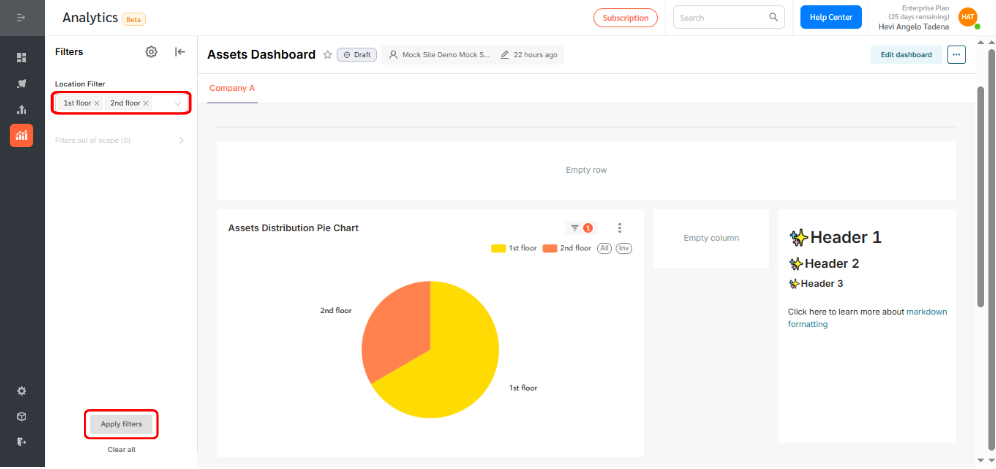
- In this example, we’ll create a filter to display asset data based on location. Start by naming your filter, then select Value as the filter type. Choose the Assets dataset, and under Columns, select Location. Click Save to apply the filter. You can repeat this process to add multiple filters as needed.
- To apply the filter, select a location from the dropdown menu and click Apply Filters.
With both basic and advanced filter options, the dashboard is highly customizable to meet your reporting needs.
The FacilityBot Analytics Dashboard offers a real-time view of your facility operations. Easily track key metrics, monitor trends, and gain insights to support smarter, data-driven decisions.
