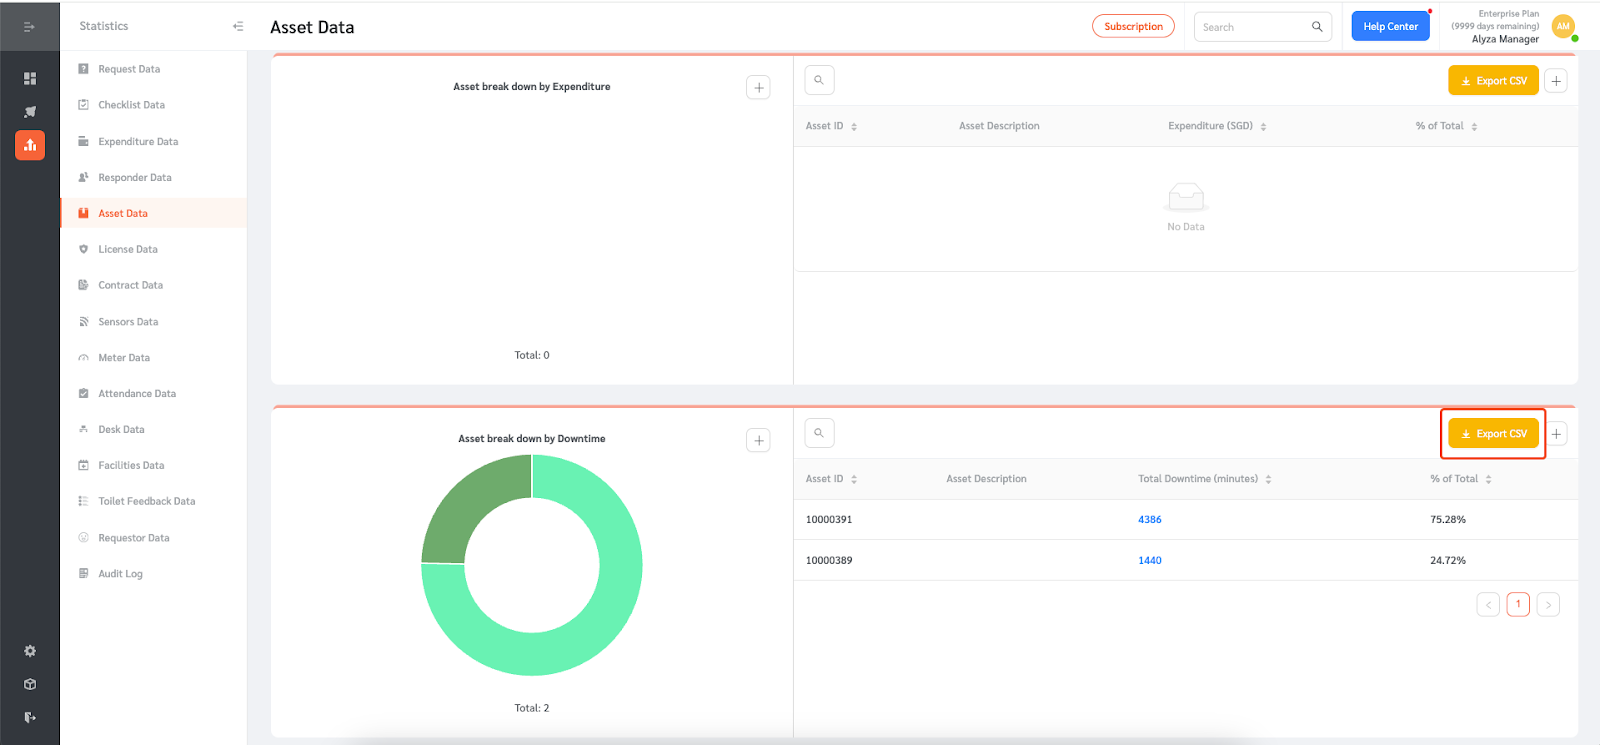
Facility managers may want to collect asset failure data to identify trends. FacilityBot’s Asset Downtime feature allows admins and managers to record when equipment is down. FacilityBot also aggregates asset downtime data in a table and chart.
Recording Asset Downtime
- Log in to FacilityBot Web Portal.
- Select “Features” then “Assets”.
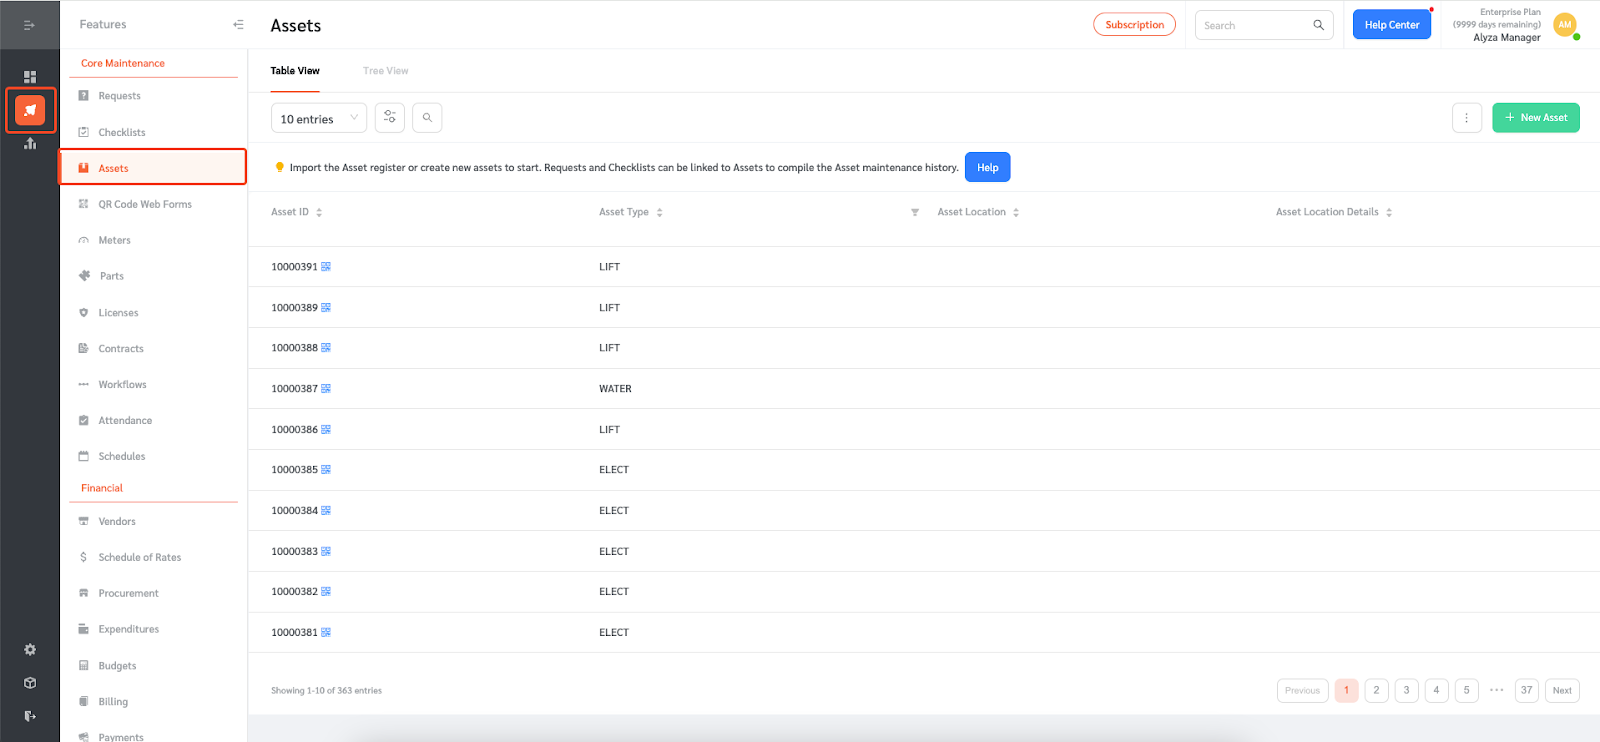
- The page shows the list of assets.
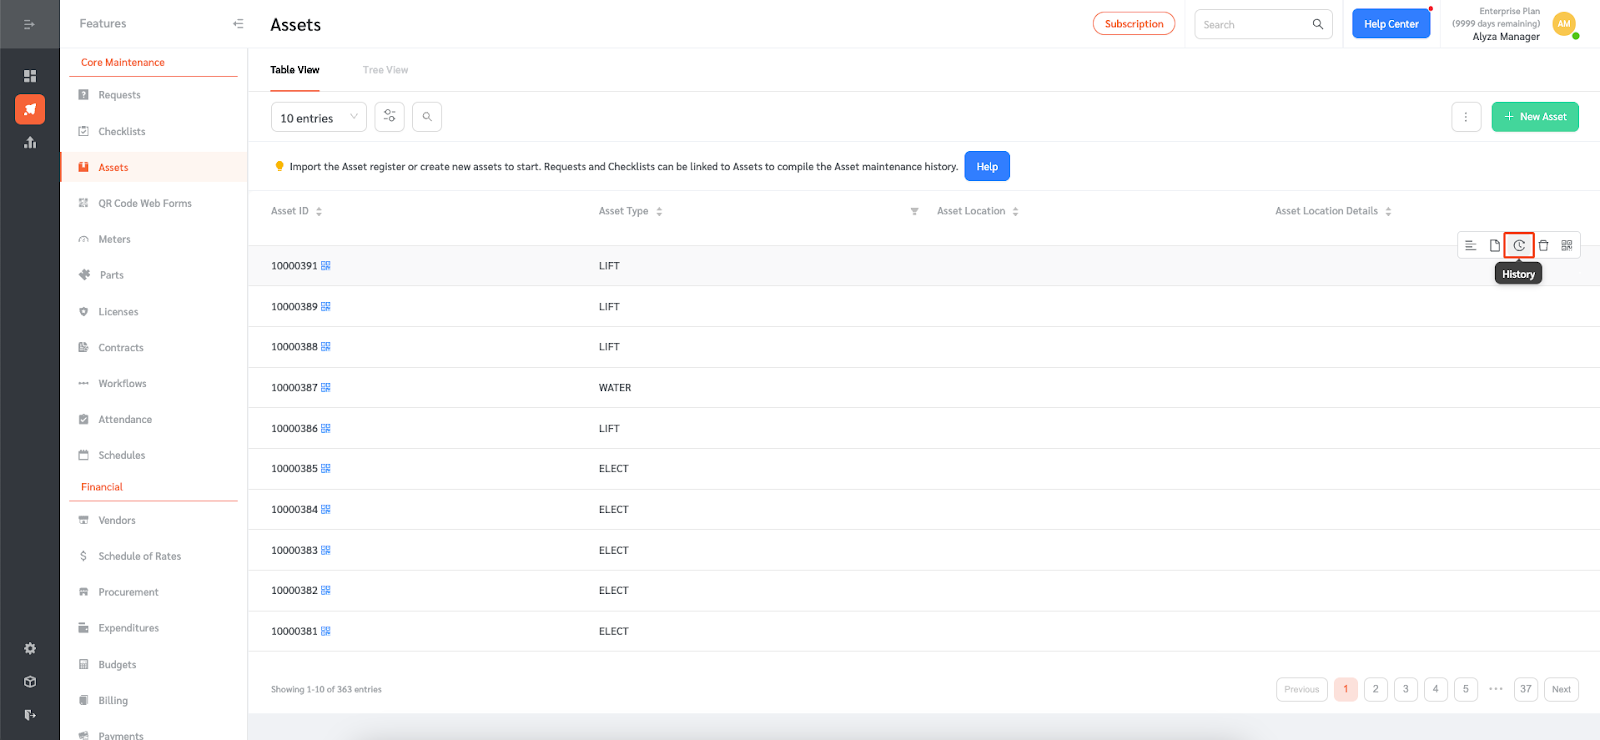
- Hover on a selected asset to show further available actions.
- Click on the clock icon to show the asset history.
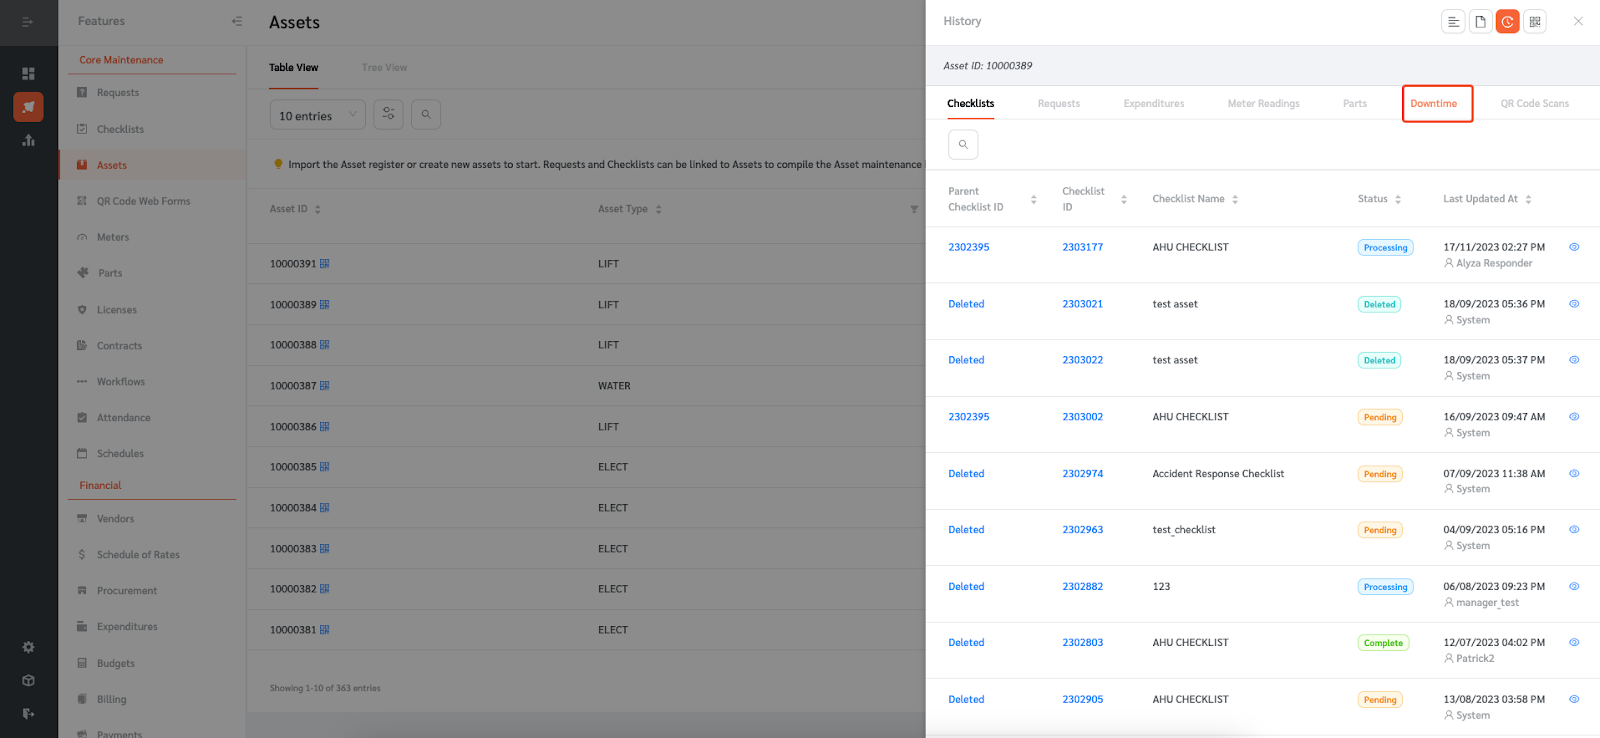
- A panel will appear on the right to show the asset history. Select “Downtime.”
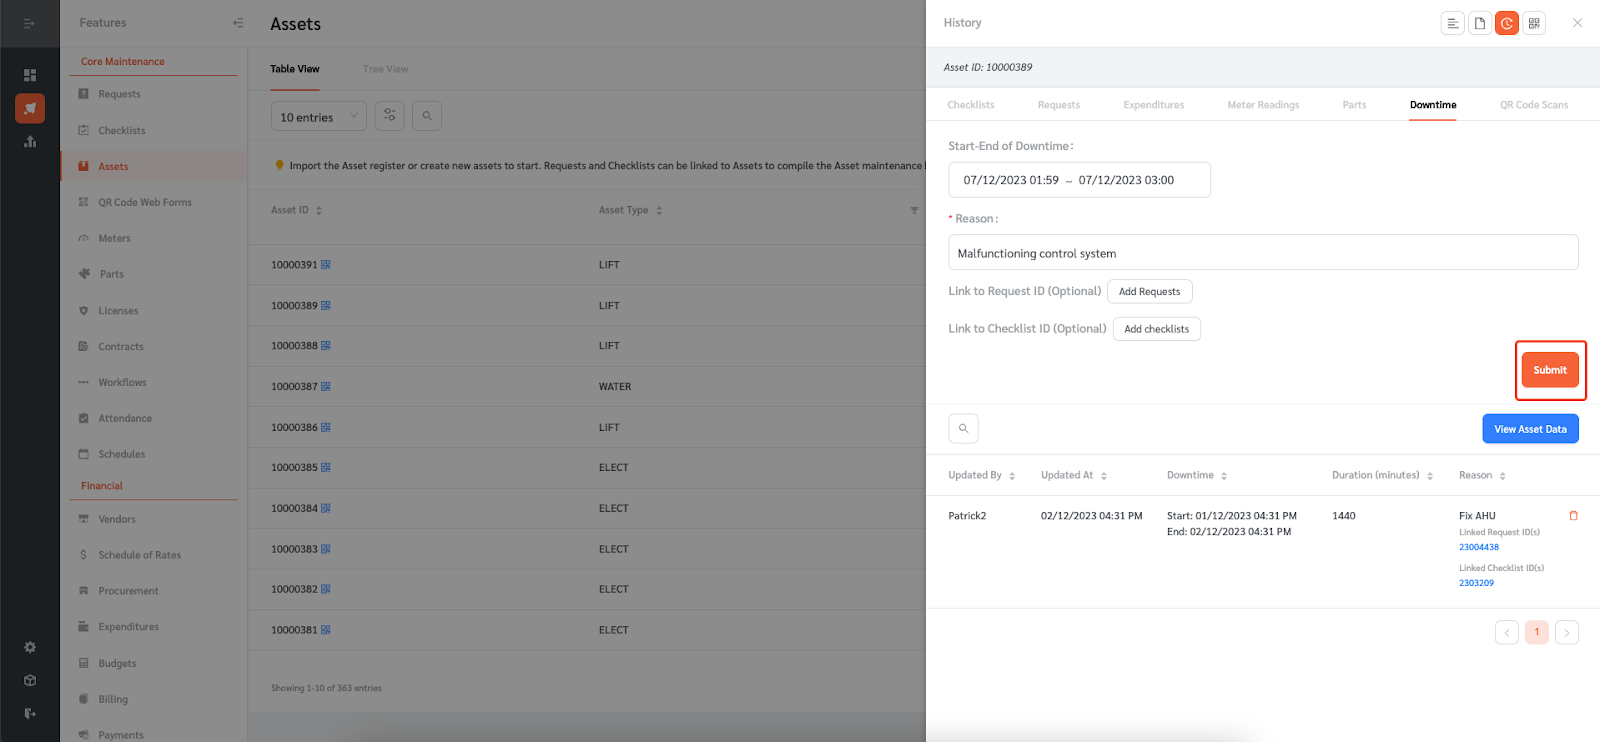
- The page changes to where managers can record asset downtime.
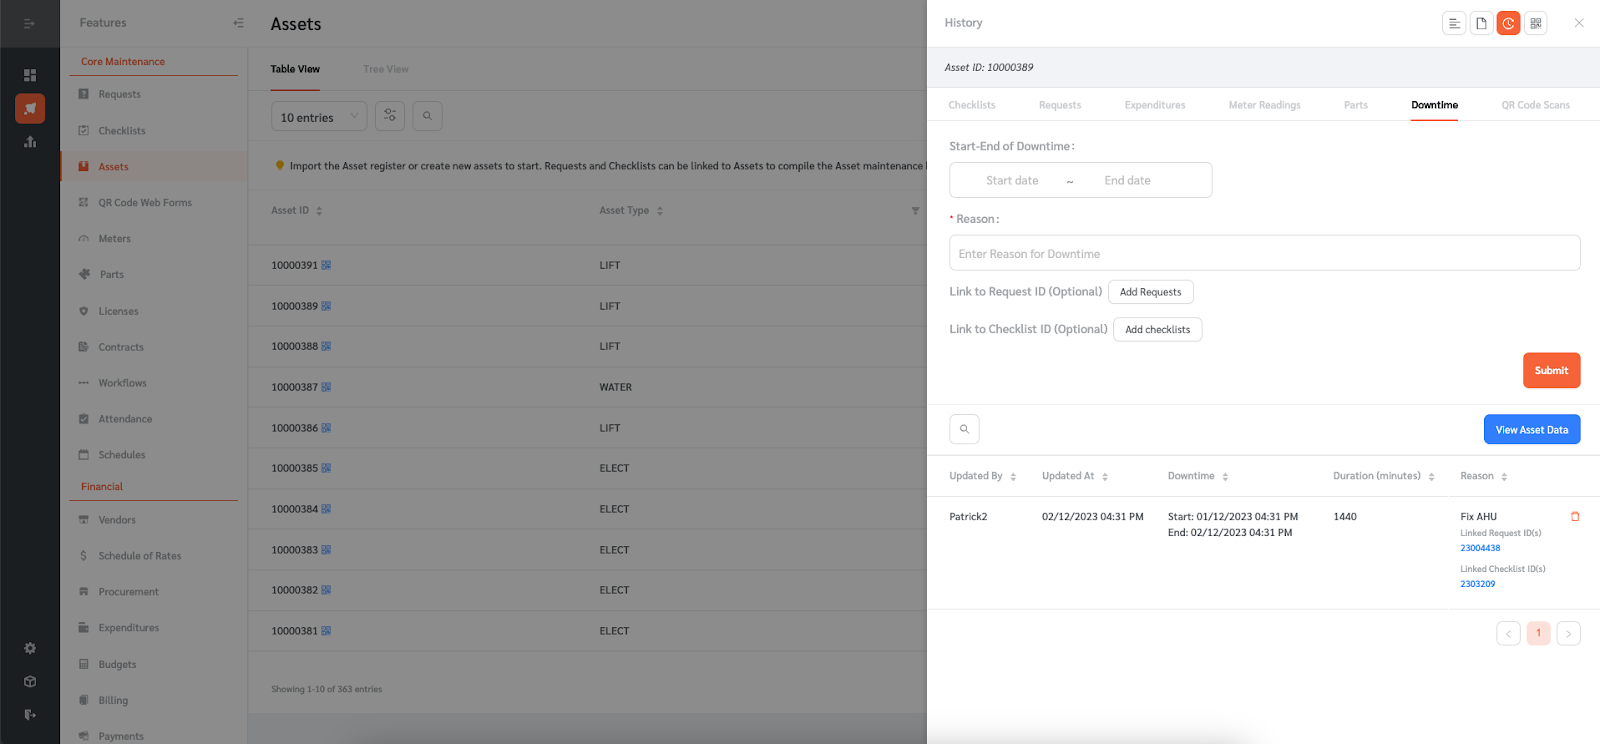
- Select the start and end of the asset downtime by entering the date and time when the equipment failure began and ended.
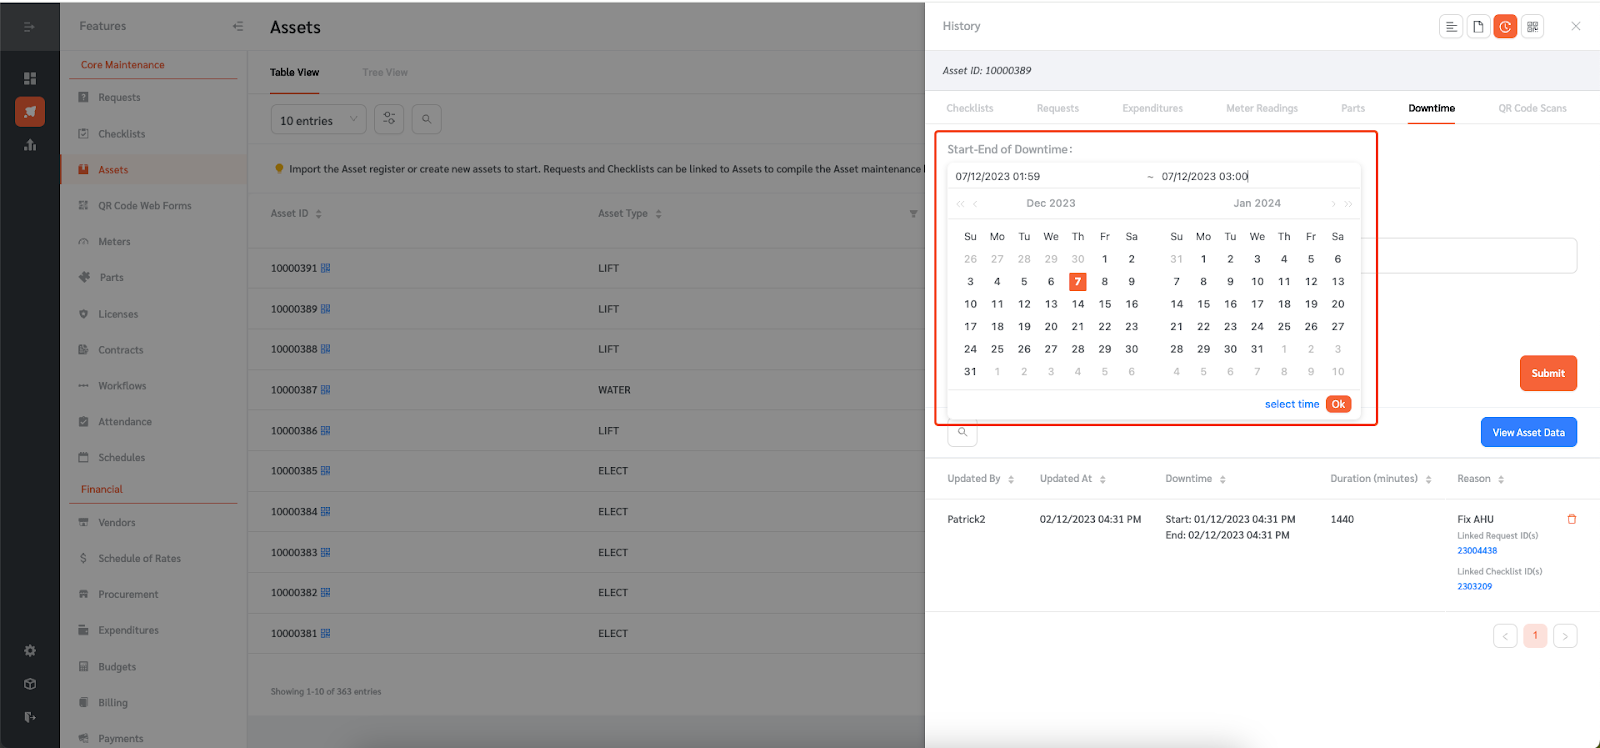
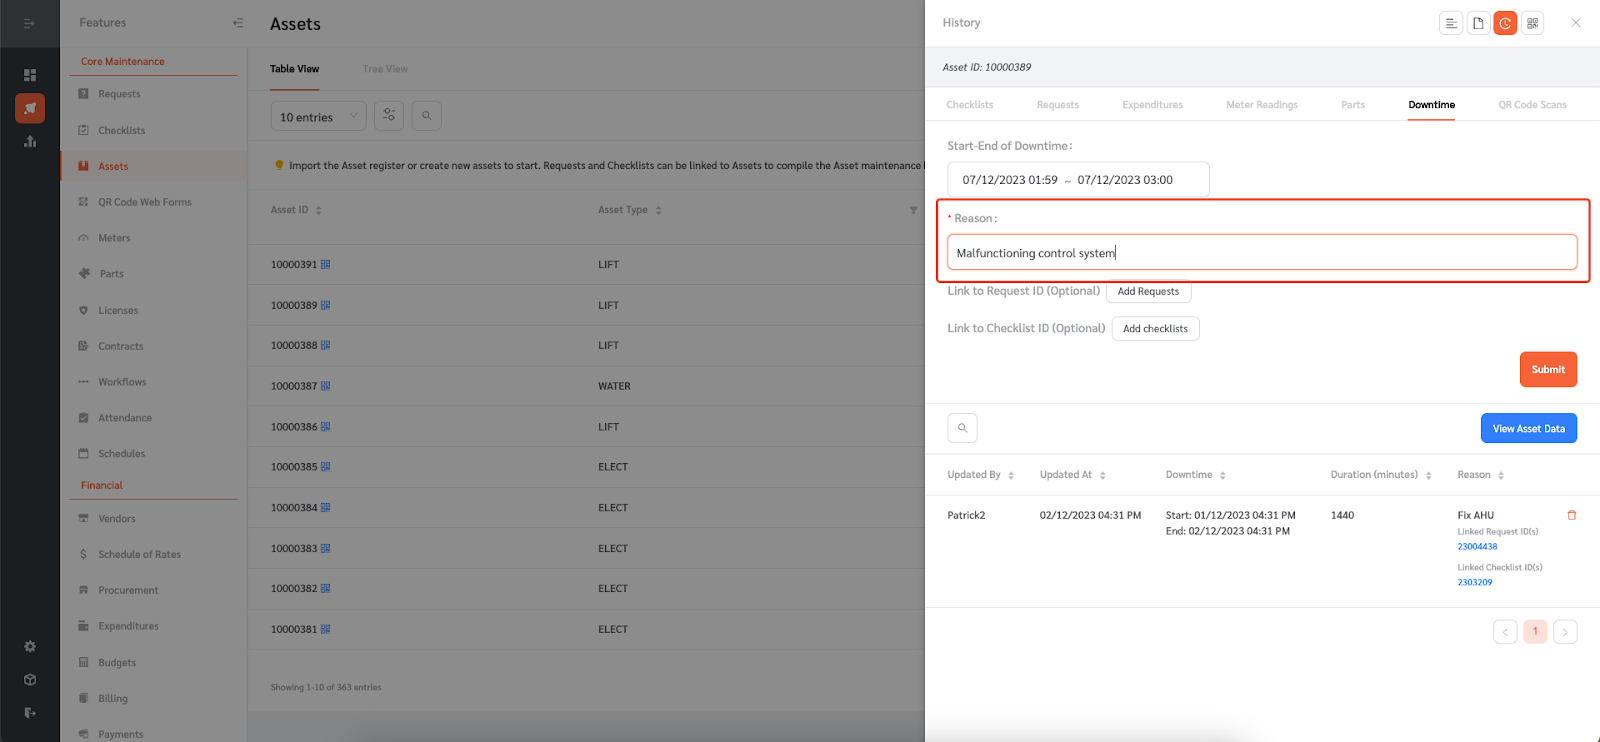
- Enter the reason for the asset’s downtime.
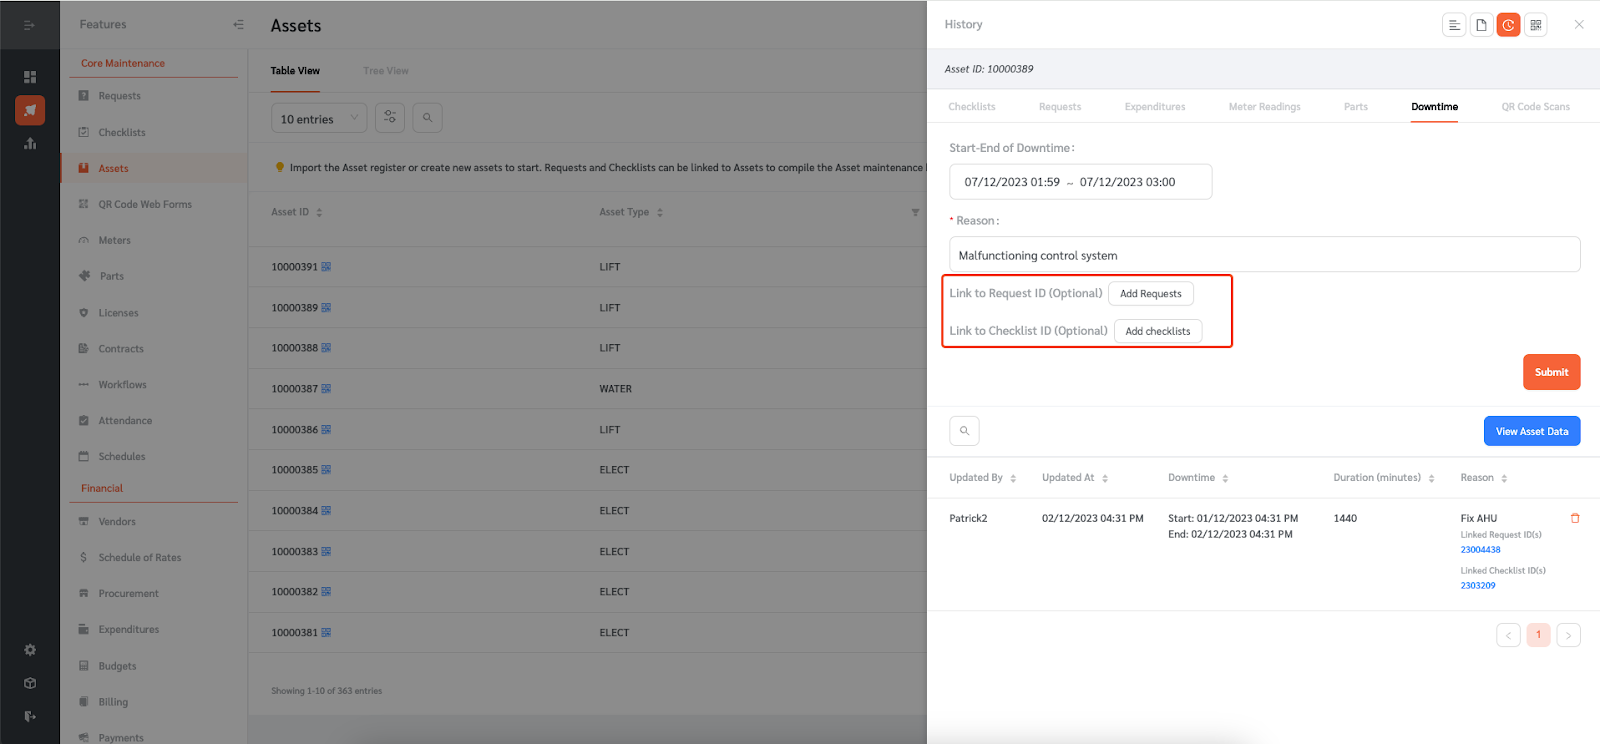
- You may also link the asset downtime to a Request ID or Checklist ID.
- Once all the necessary information has been entered, click “Submit.”
Managing Asset Downtime Statistics
- All recorded asset downtime will appear in the table below.
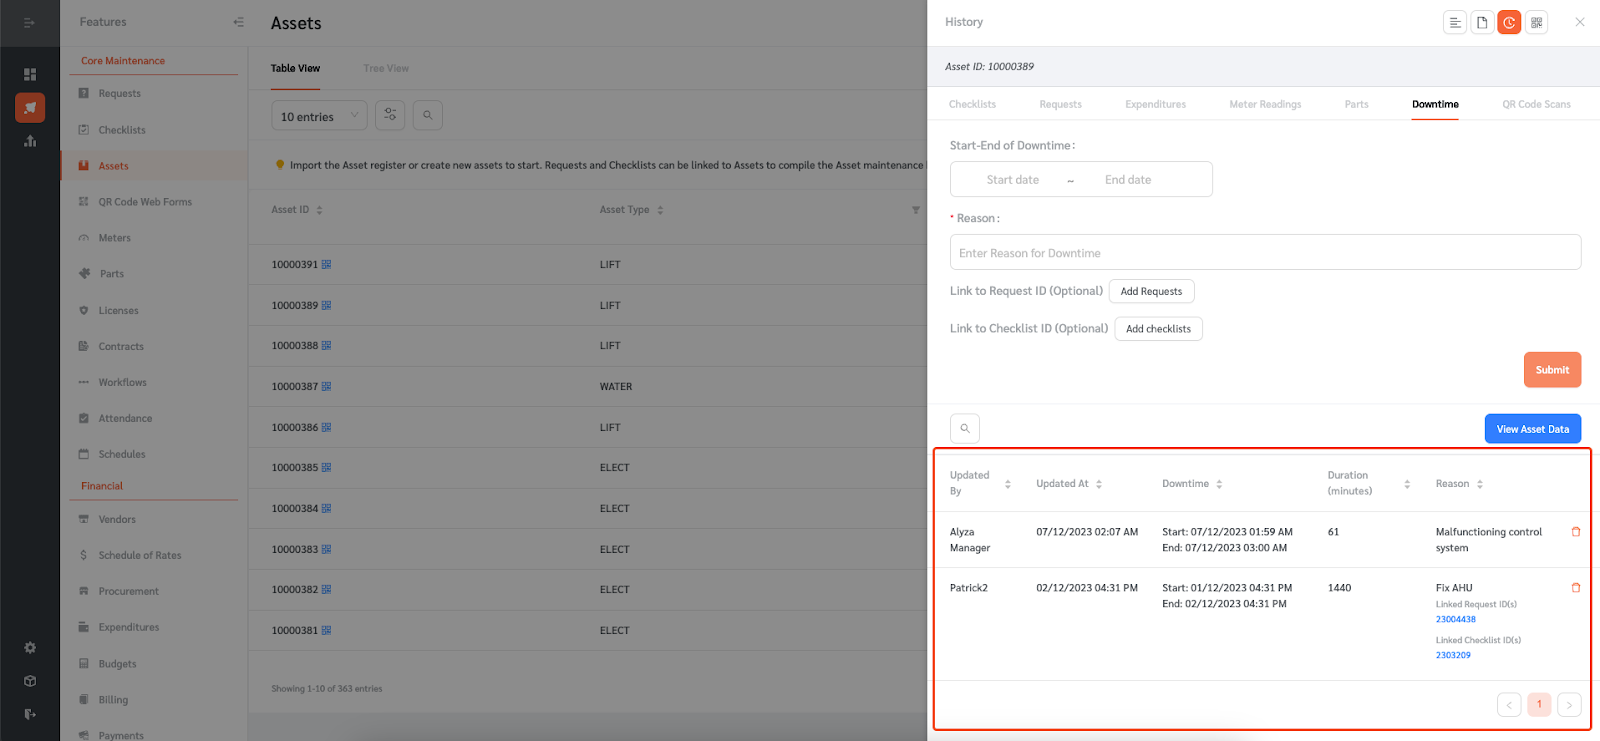
- The table shows the history of the asset downtime.
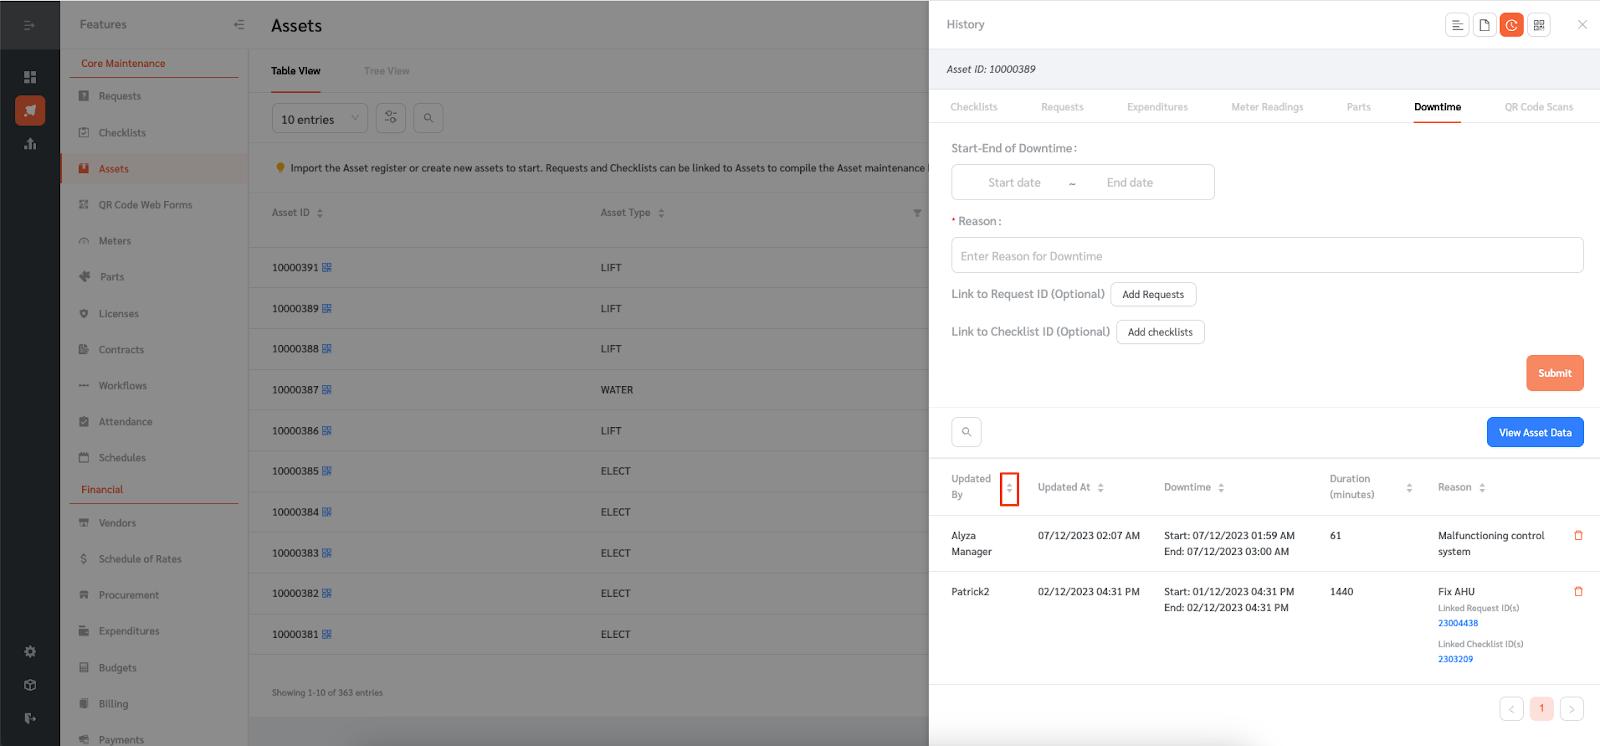
- You can sort the table by clicking on the sort icons beside the categories in each column.
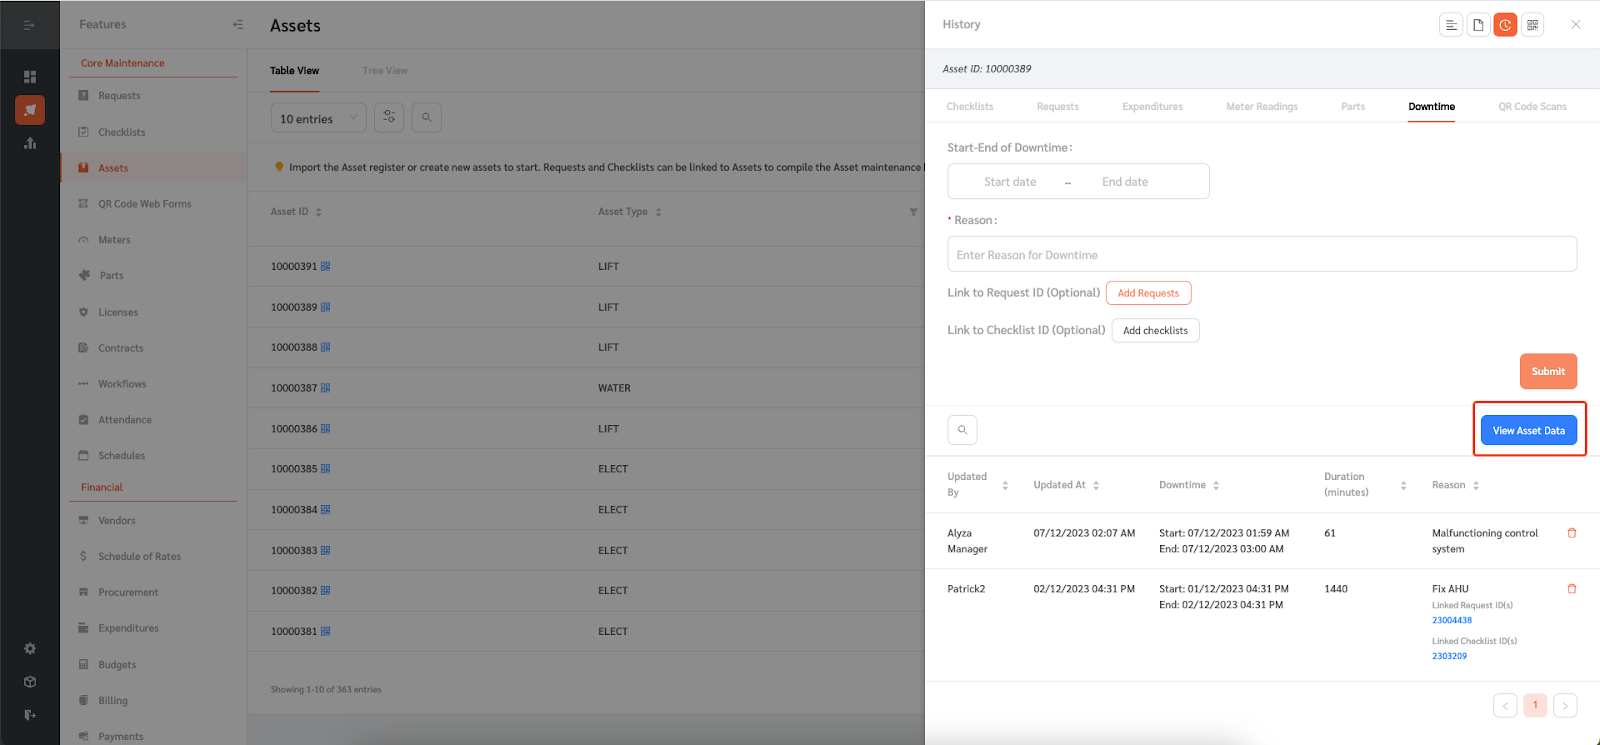
- FacilityBot also aggregates the asset downtime data. Click on “View Asset Data” to see the aggregated downtime data.
- Alternatively, you can go to “Statistics” → “Assets” and scroll down to see the aggregated downtime data.
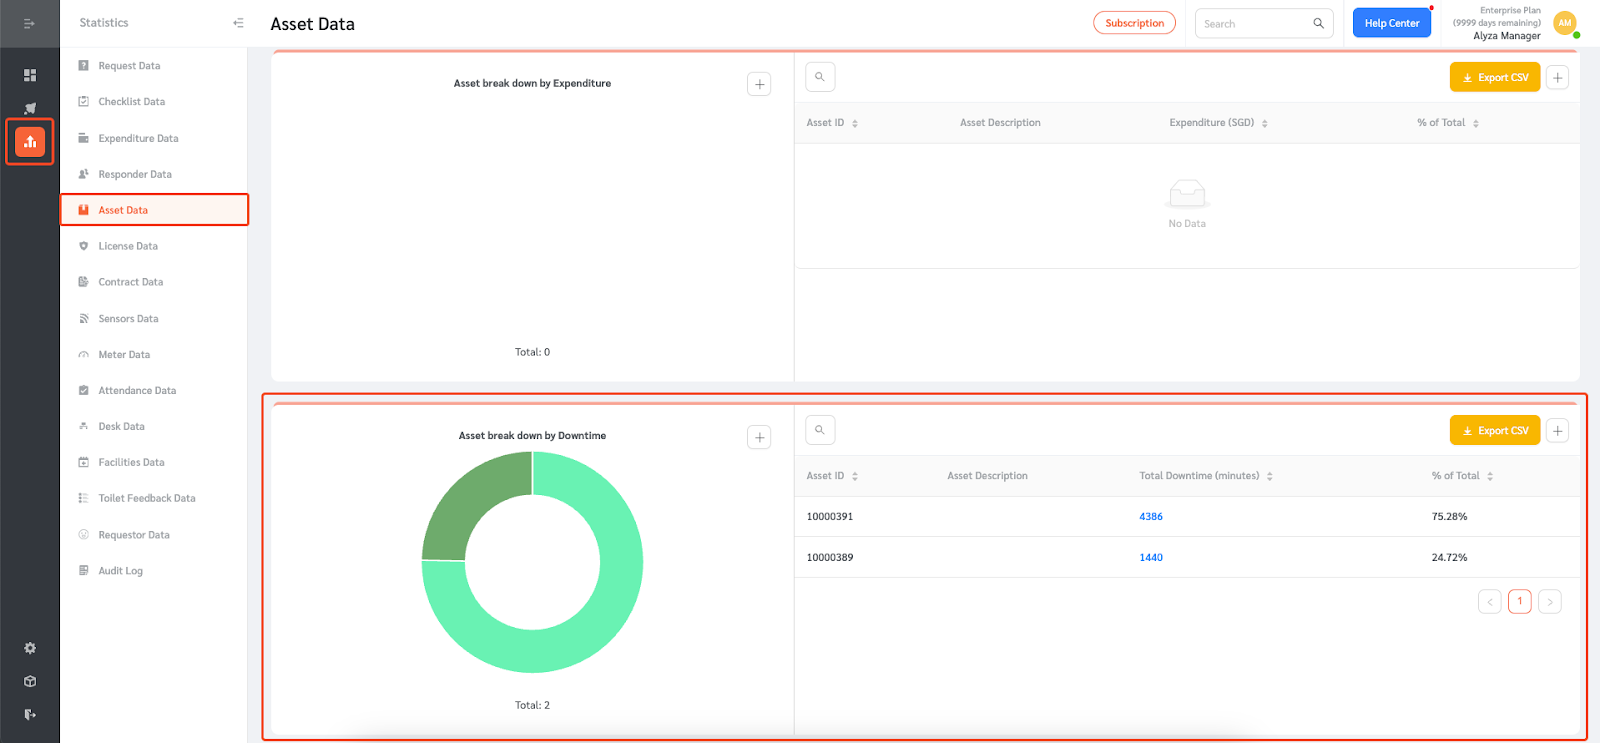
- The statistics show the breakdown of assets by downtime. It shows the total downtime (in minutes) and percentage of downtime per asset.
- The downtime data chart and table can be added to the custom dashboard by clicking on the plus icon.
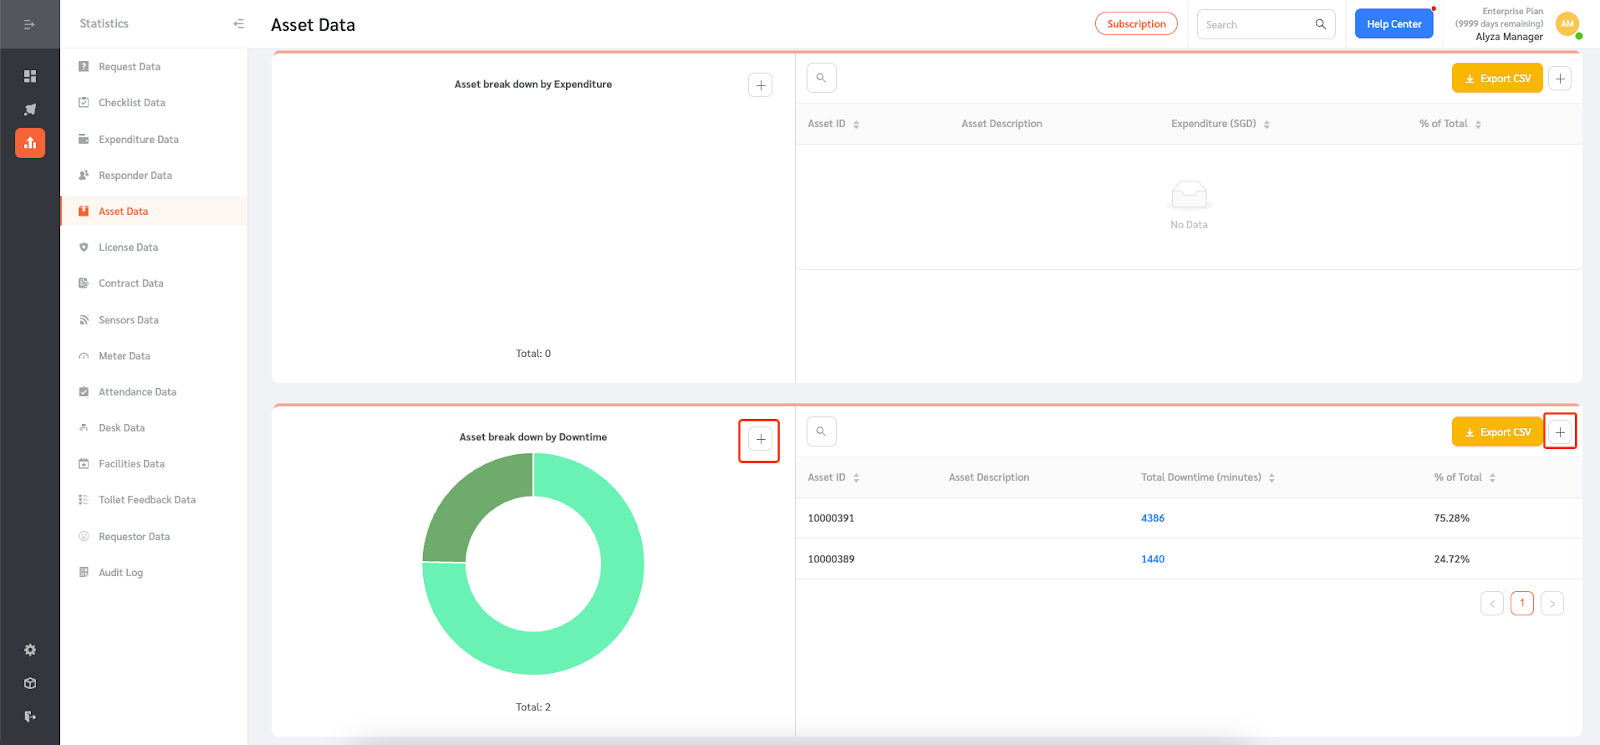
- The asset downtime table can also be exported as a CSV by clicking on this button.
