Admins and managers may want to view charts and tables displayed in a single-page dashboard in different ways. FacilityBot has an internal customizable dashboard that uses a widget-based approach. Current charts/tables available in the “Statistics” section can be added as “widgets” to the custom dashboard. Users can then configure parameters for that chart or table such as filters.
Creating a Custom Dashboard
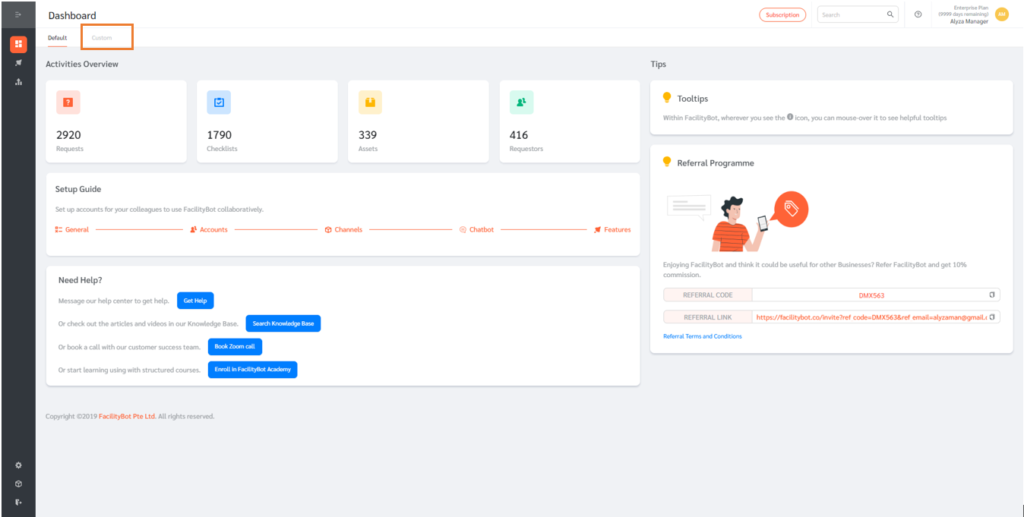
- Log in to FacilityBot Portal. The first thing you will see is the dashboard. FacilityBot gives you the option to view the default dashboard or create a custom one.
- To create a custom dashboard, go to the Custom section.
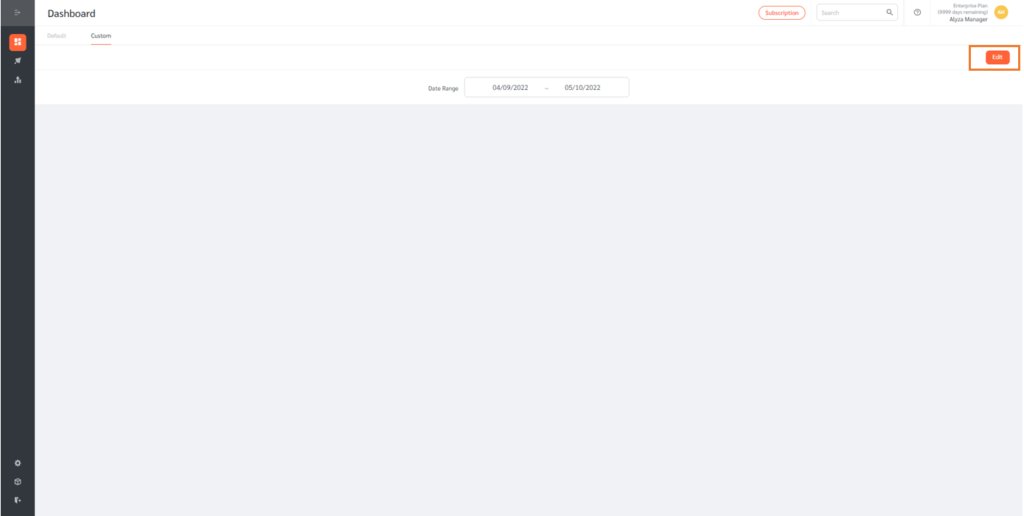
- Edit the dashboard by clicking on the Edit button on the far right.
- Add a widget by clicking on the Add Widget button
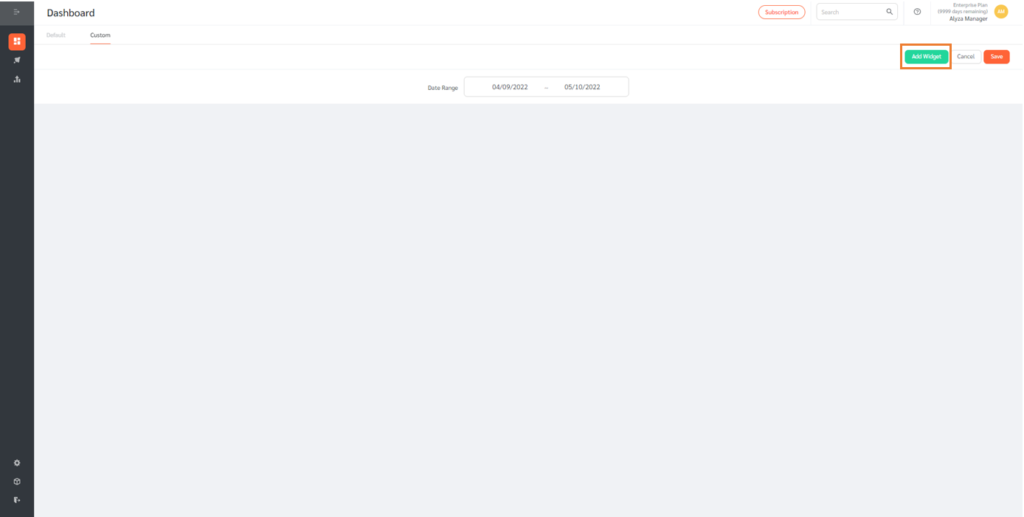
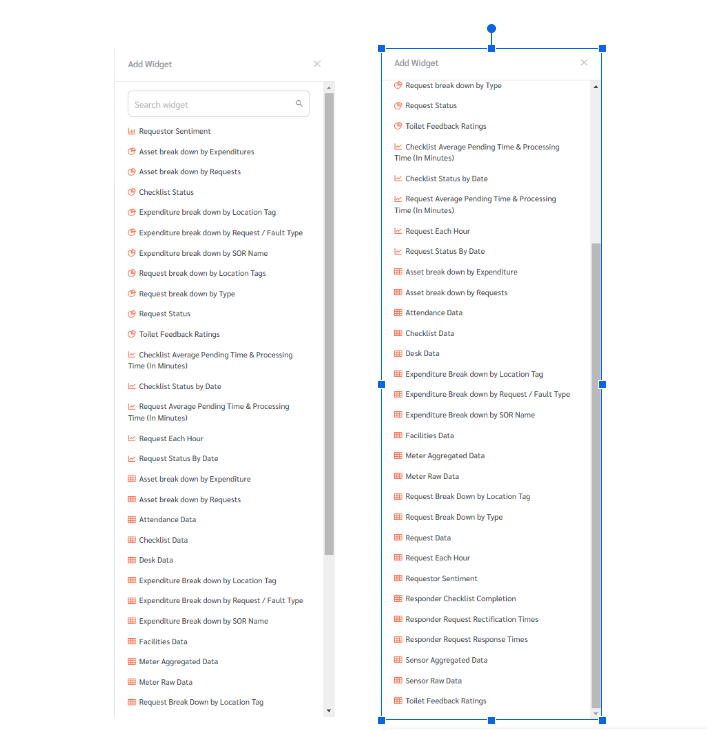
- FacilityBot gives you the option to add various widget types.
- You may also search for a specific widget using the search field.
- You may drag the widgets to change their position.
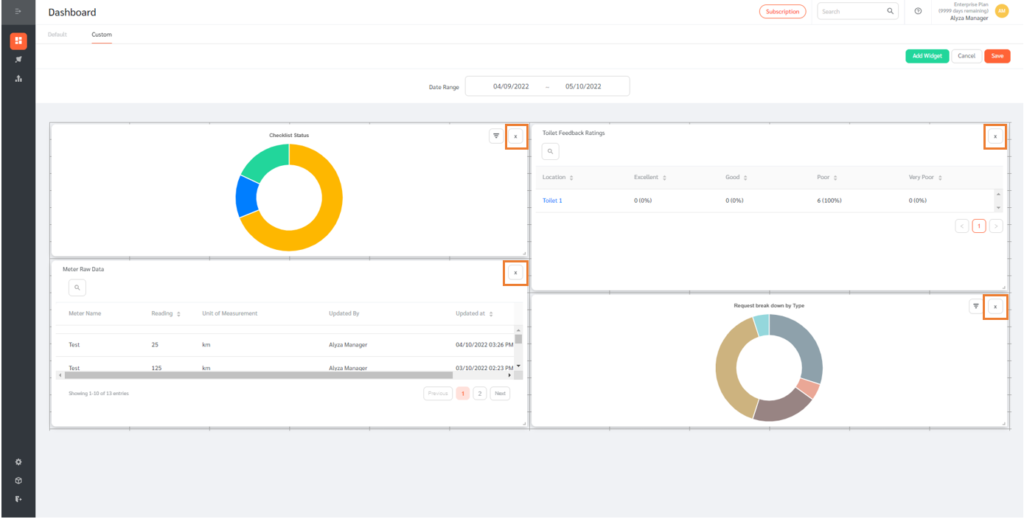
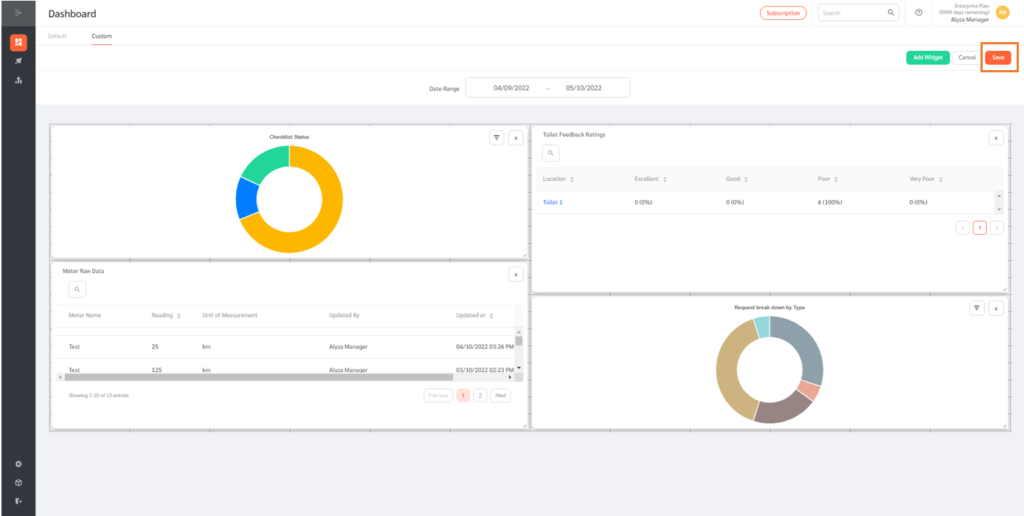
- Delete a certain widget by clicking on the X icon located on the upper right of each widget.
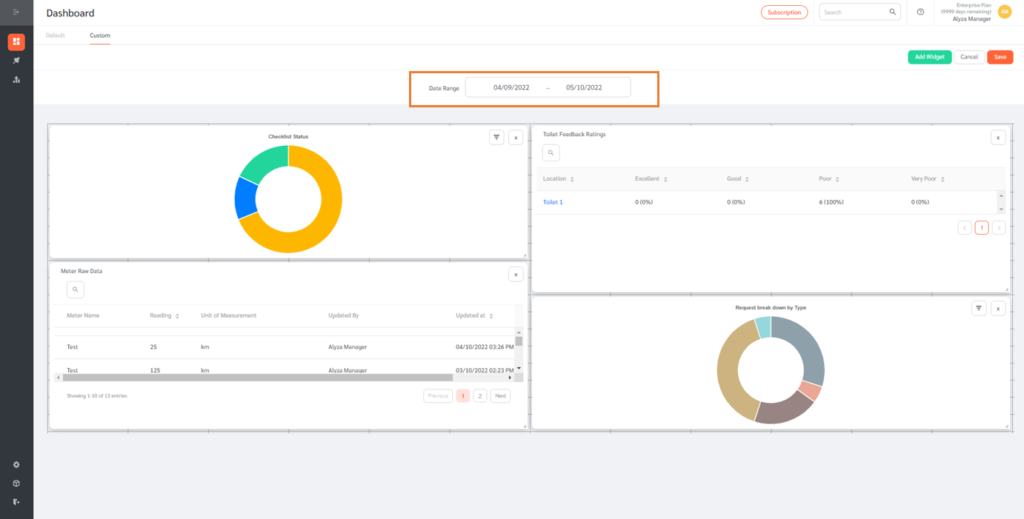
- You may also use the date range filter to view certain statistics within the range.
- Depending on the widget, you may be able to see individual filters that apply to that widget.
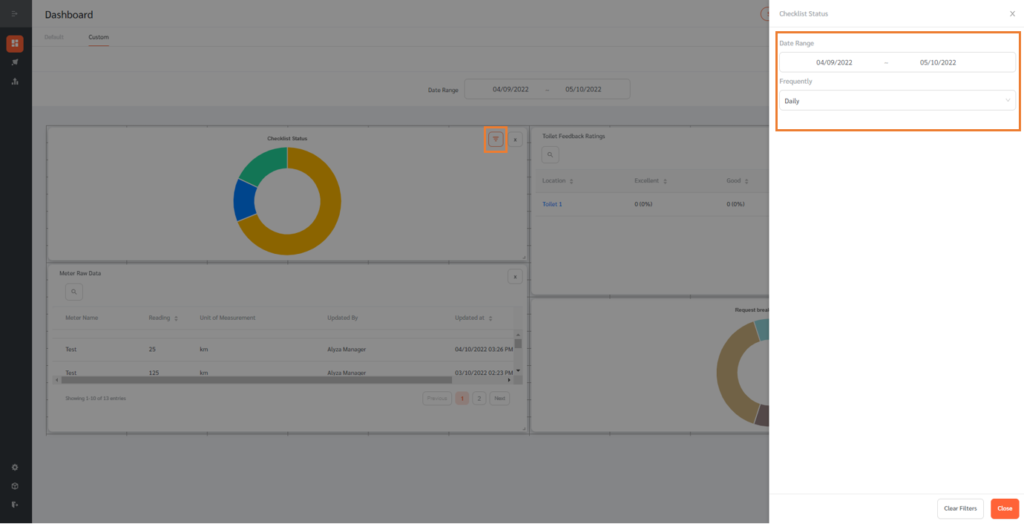
- To view and edit individual widget filters, click on the icon at the top right. An editing panel will appear on the right to edit the filers.
- Click on the Save button on the lower right to save the changes.
- After creating your custom dashboard, click Save to update the changes.
Adding Notes to Custom Dashboard
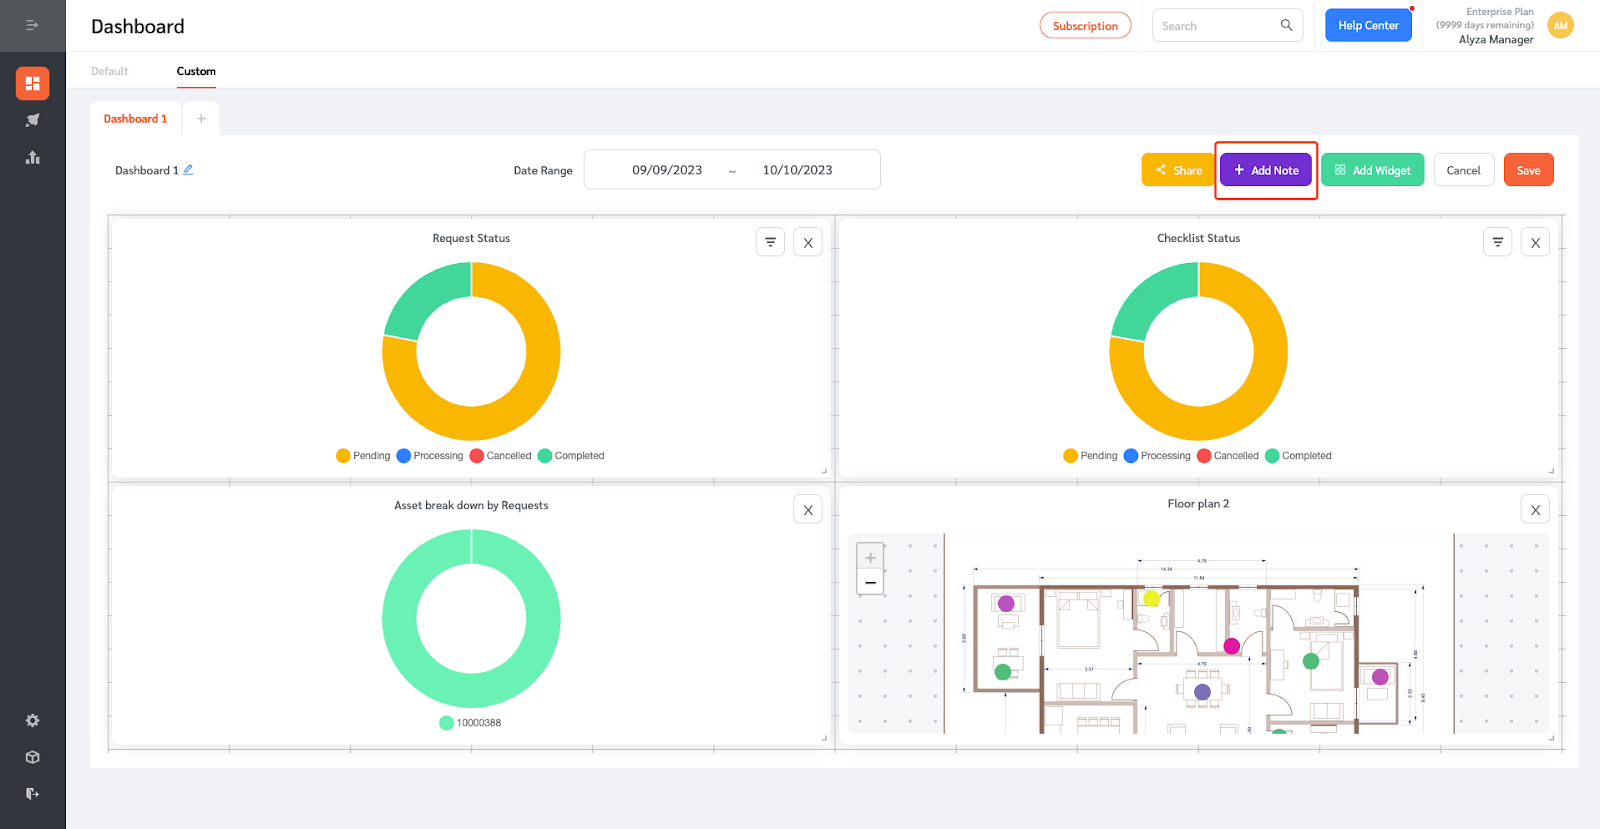
Managers can add notes to the Custom Dashboard.
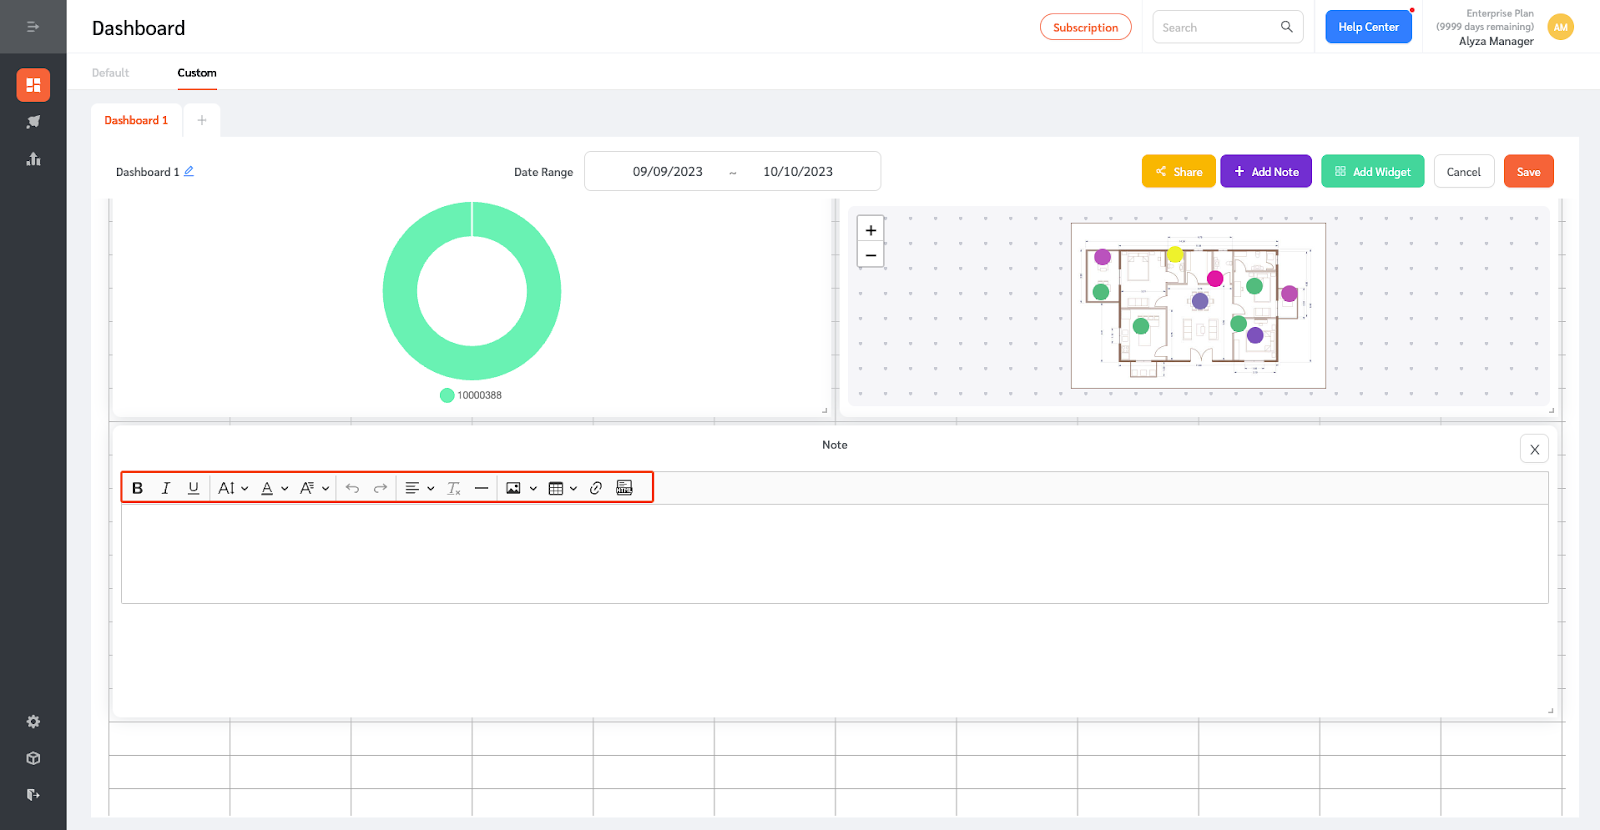
- Click on the Add Note button on the upper right.
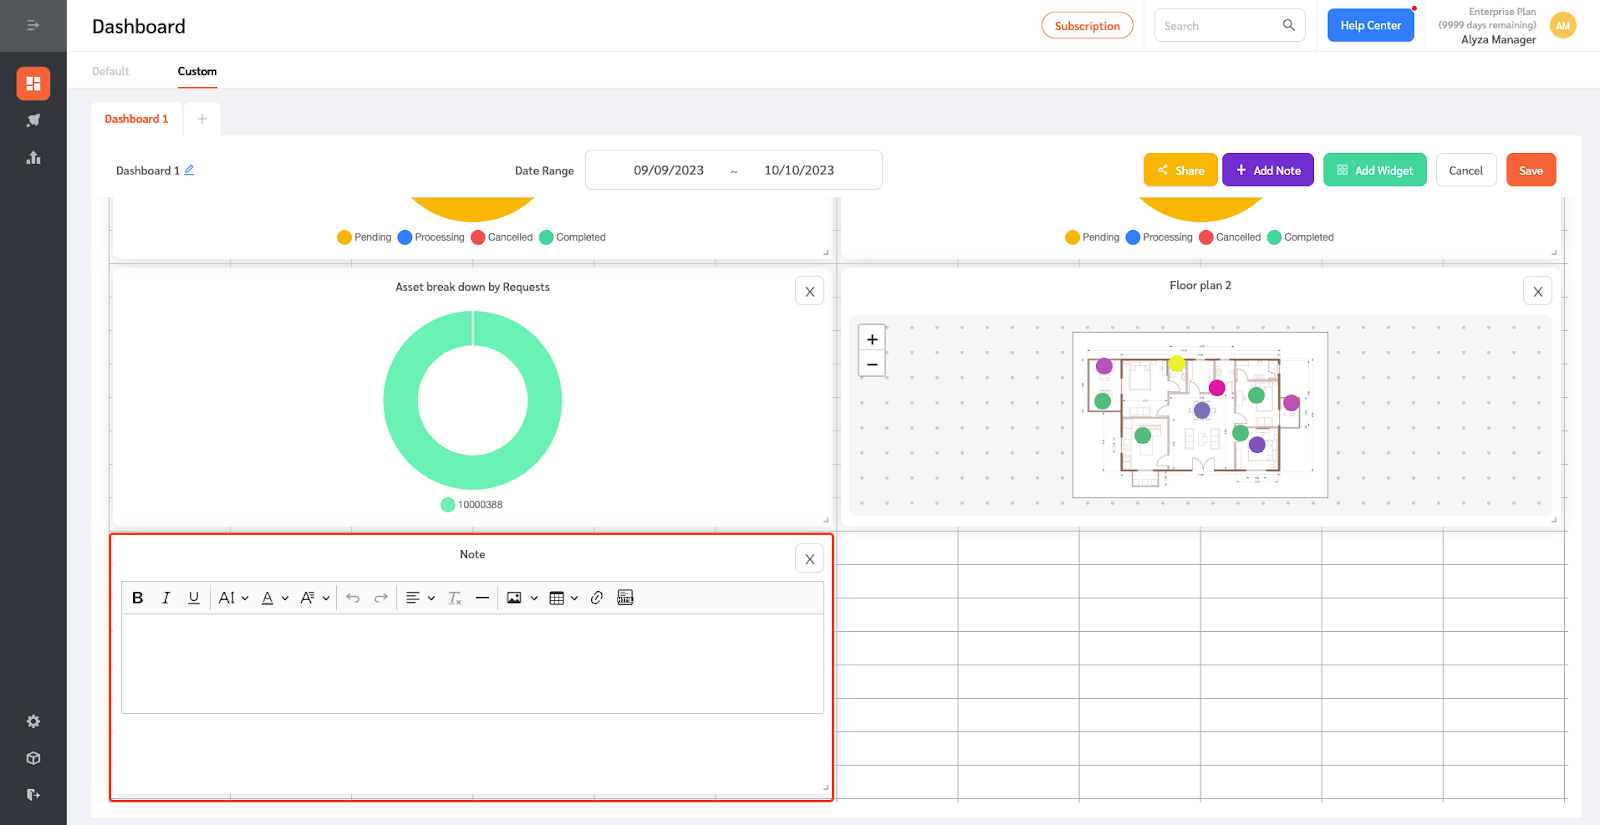
- A new widget will appear where you can add the notes.
(Note: Each dashboard can have a maximum of ten note widgets.)
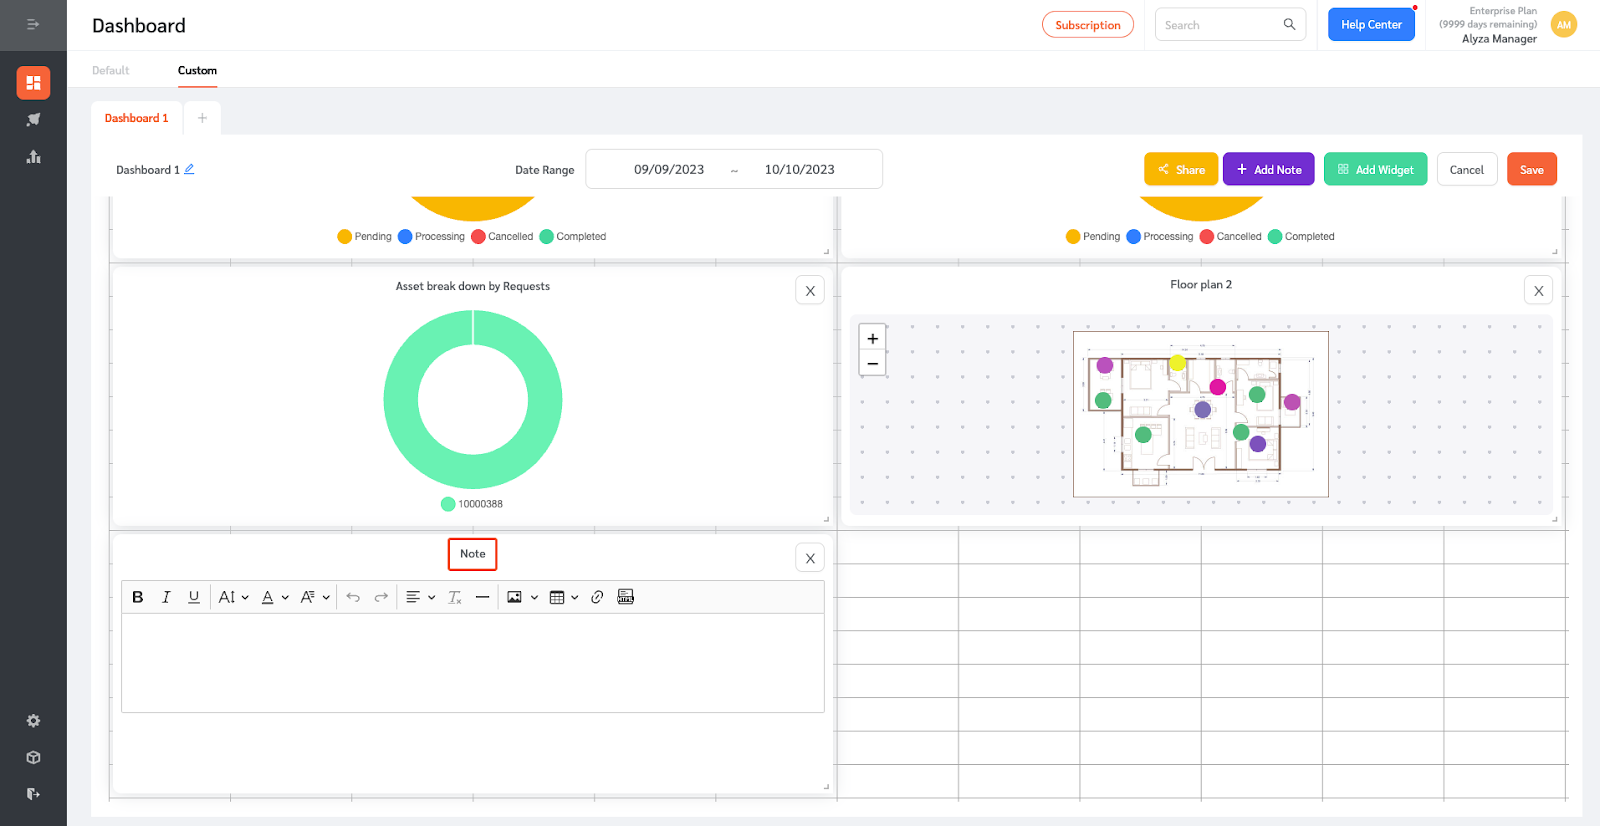
- Give your new note a name by clicking on the name field.
- Adjust the size of the widget by dragging the corner of the note widget.
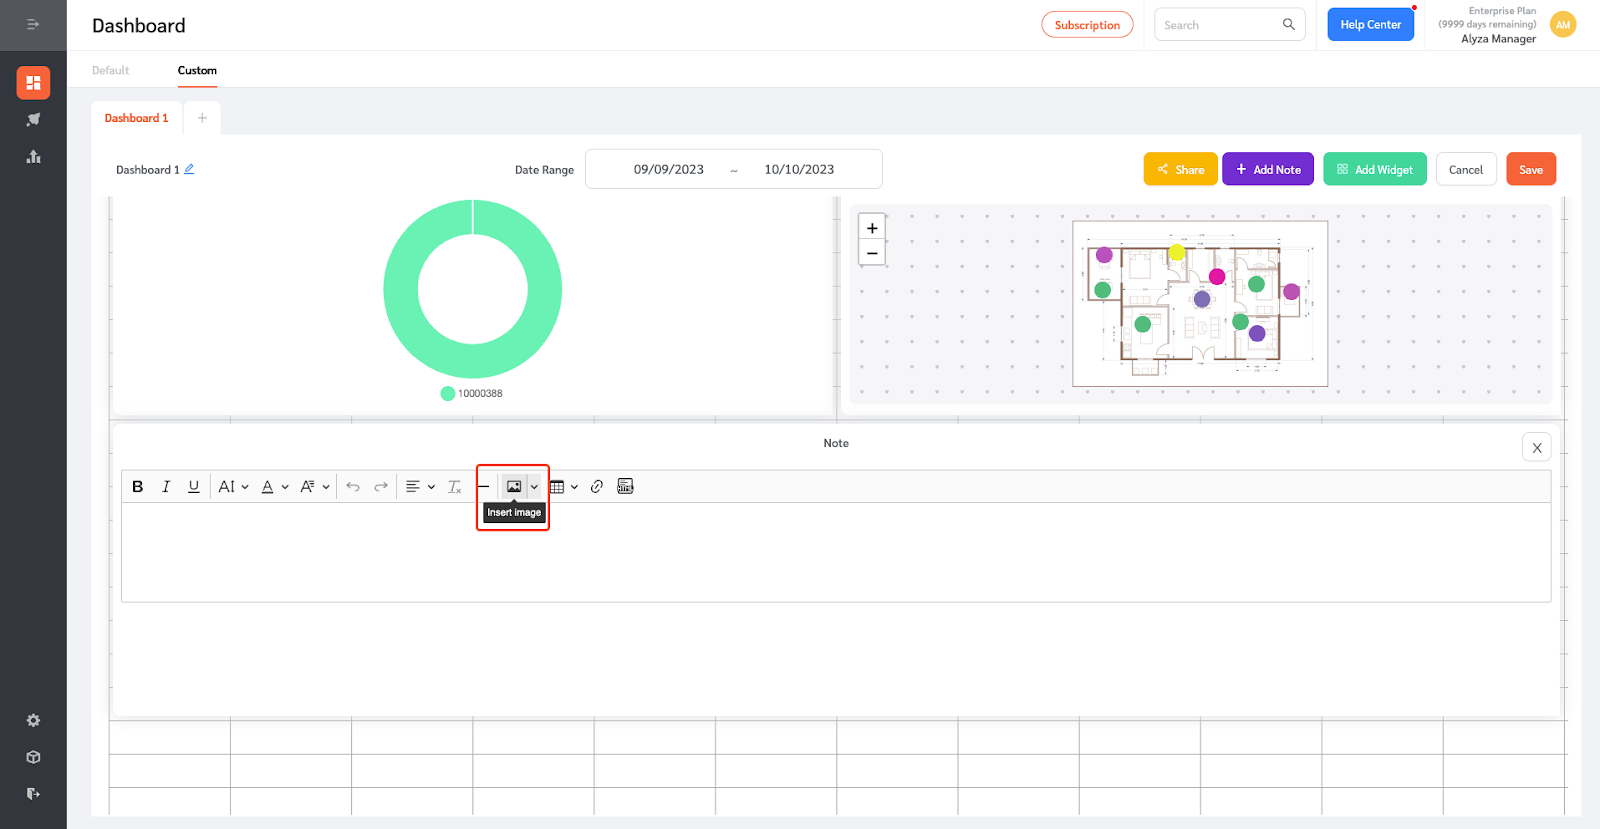
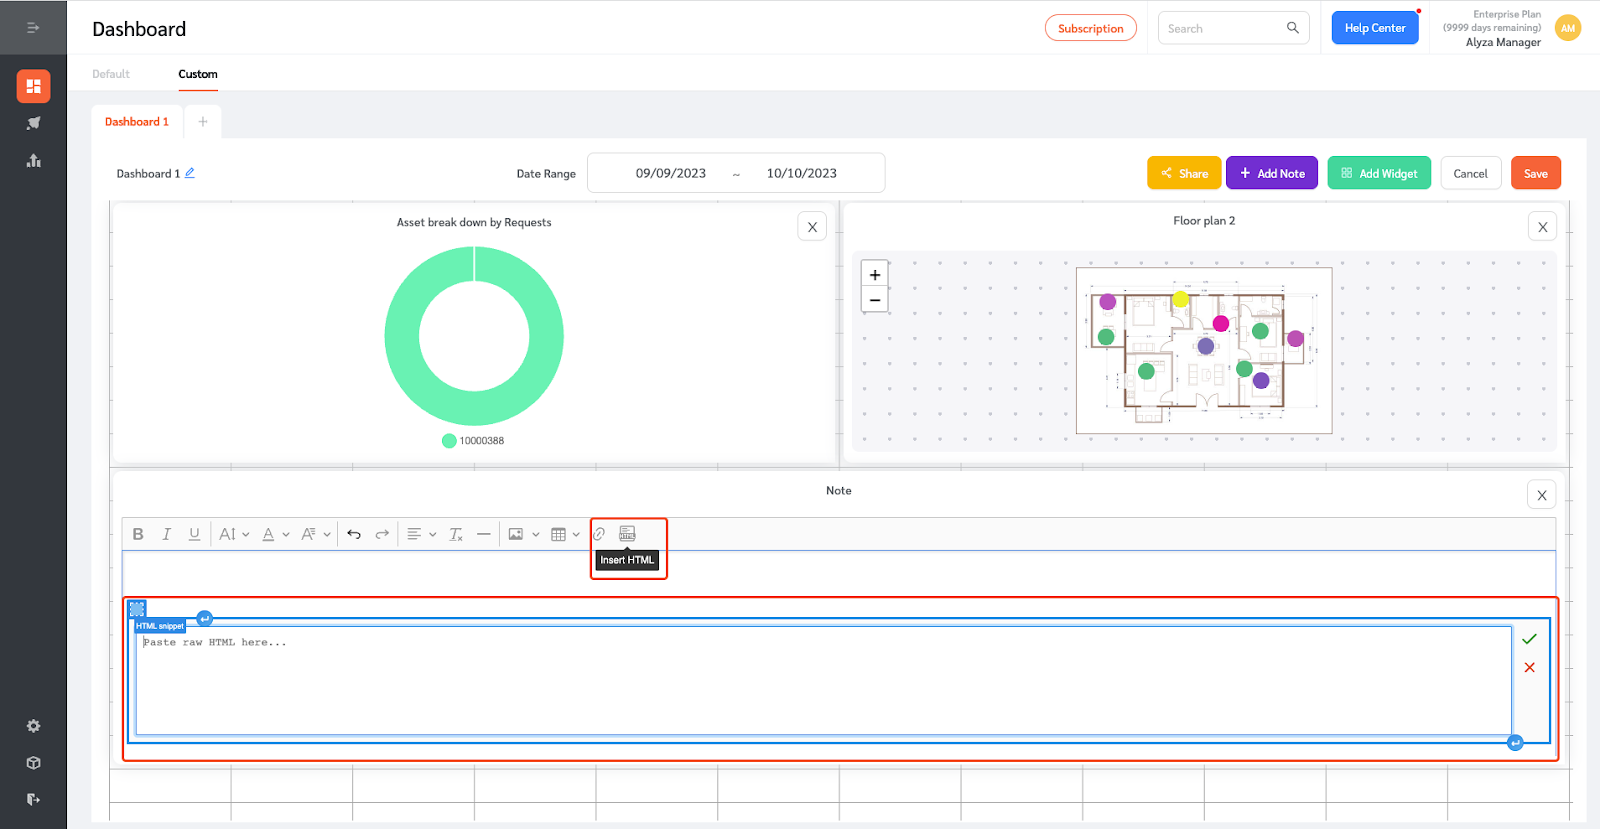
- Edit the note using the action buttons.
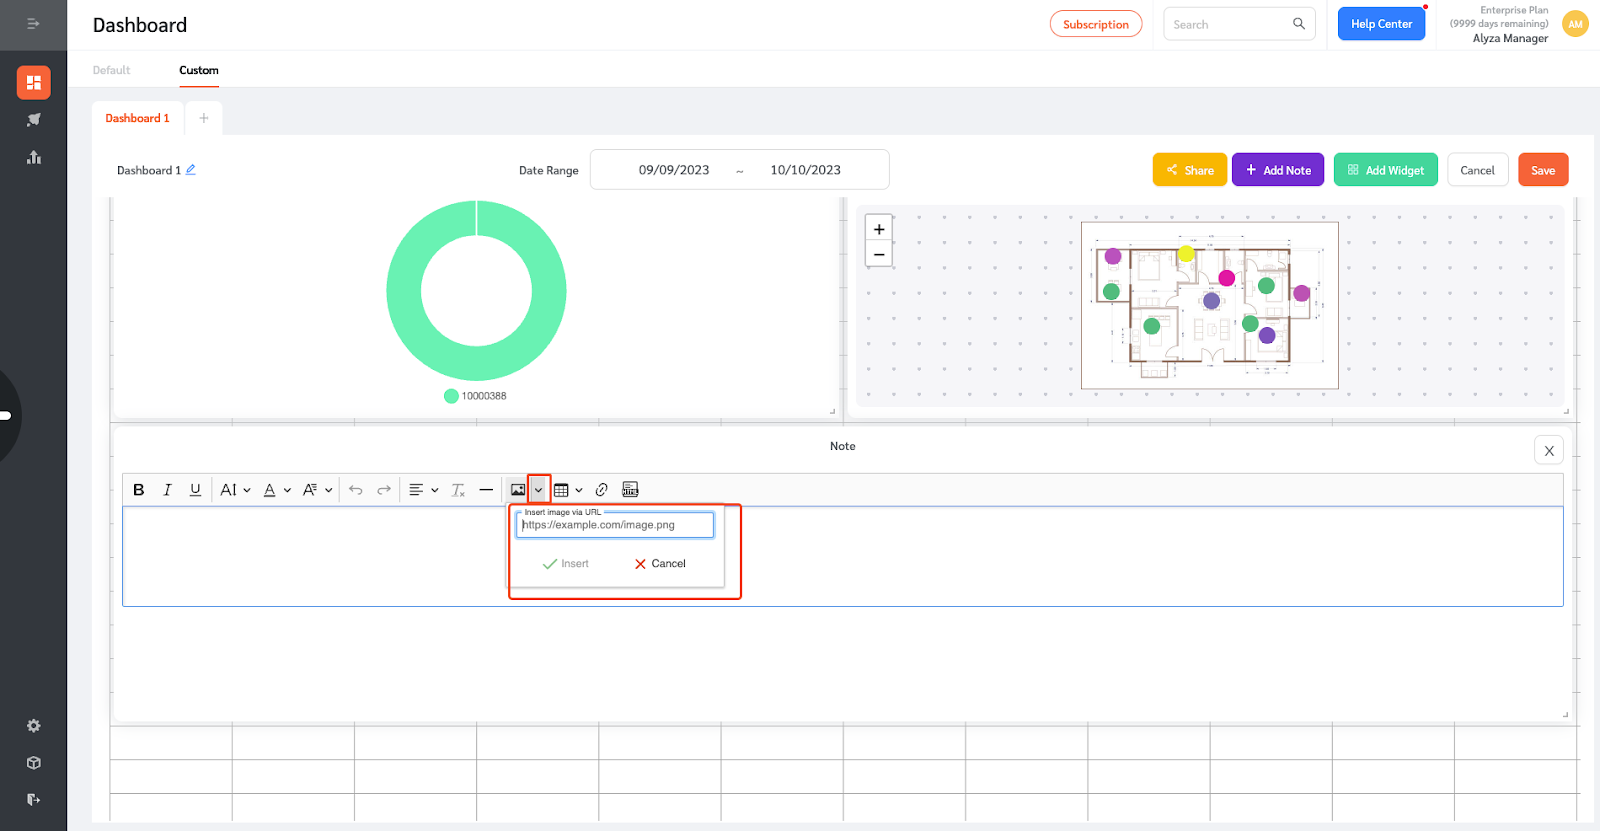
- Managers can insert an image by uploading a png or jpeg file or by pasting the image URL.
- Text can be linked to a URL link.
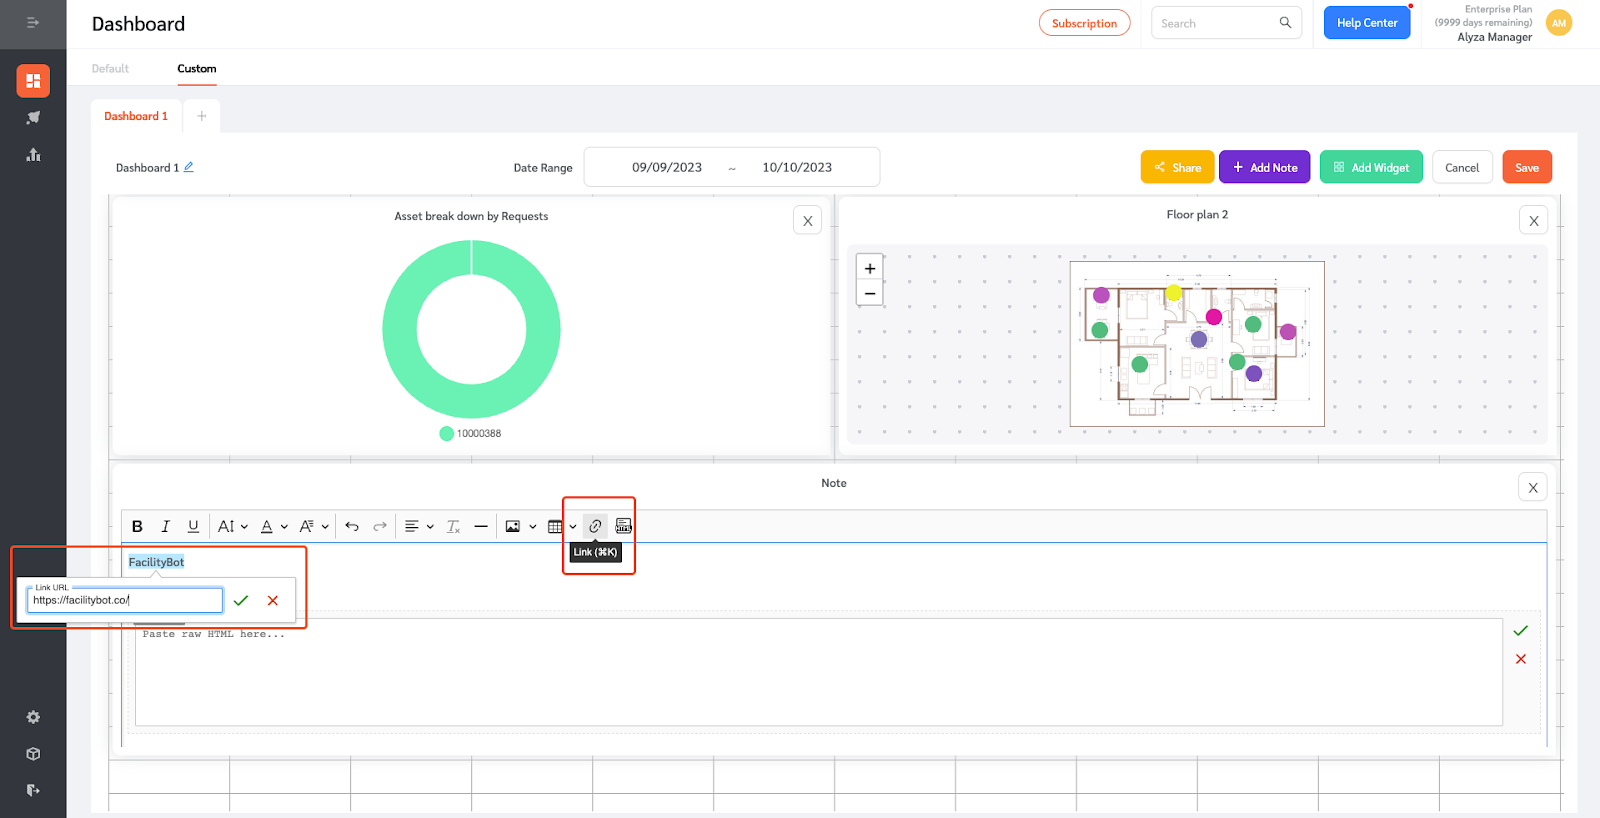
- Managers can also add raw HTML.
Webview URL
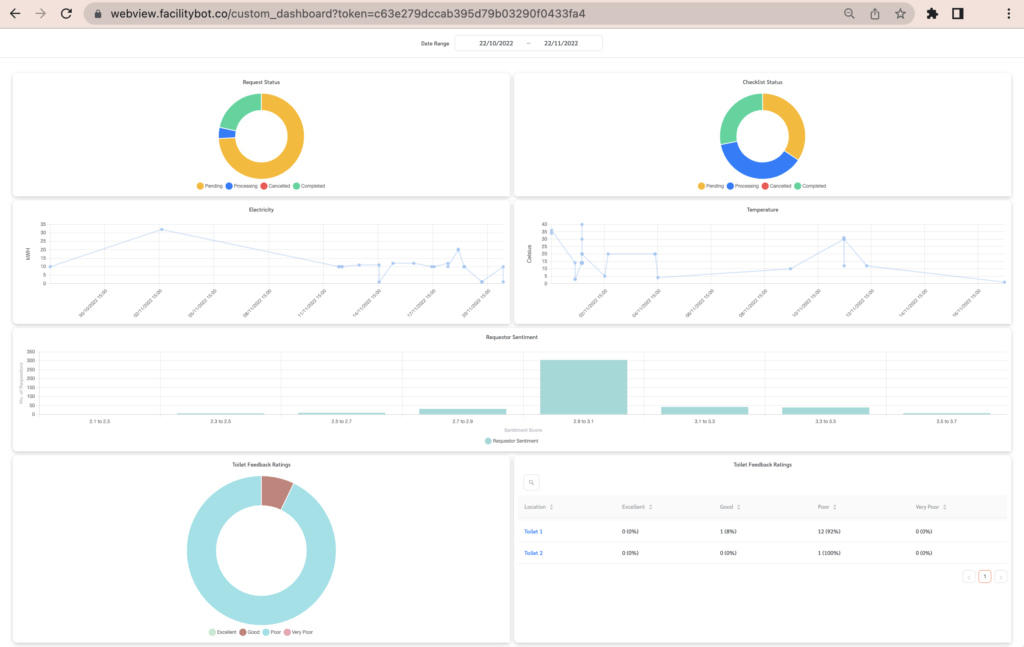
FacilityBot also lets users access the custom dashboard in a webview. Users can copy the URL and paste it into a browser to access the custom dashboard webview.
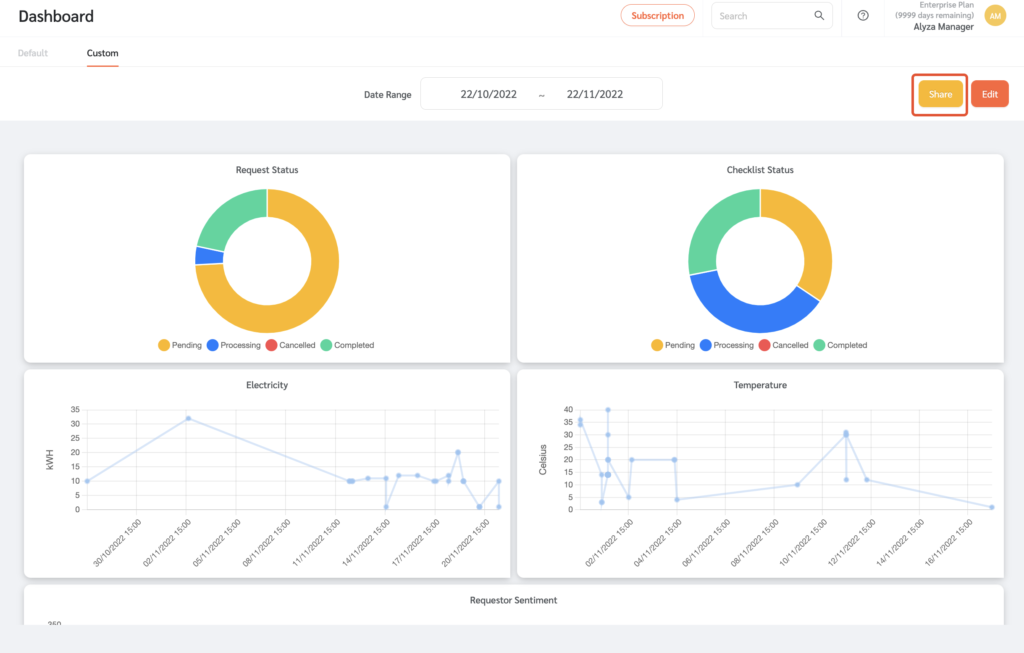
- On the Custom Dashboard page, click Share.
- A floating panel will appear with the webview URL.
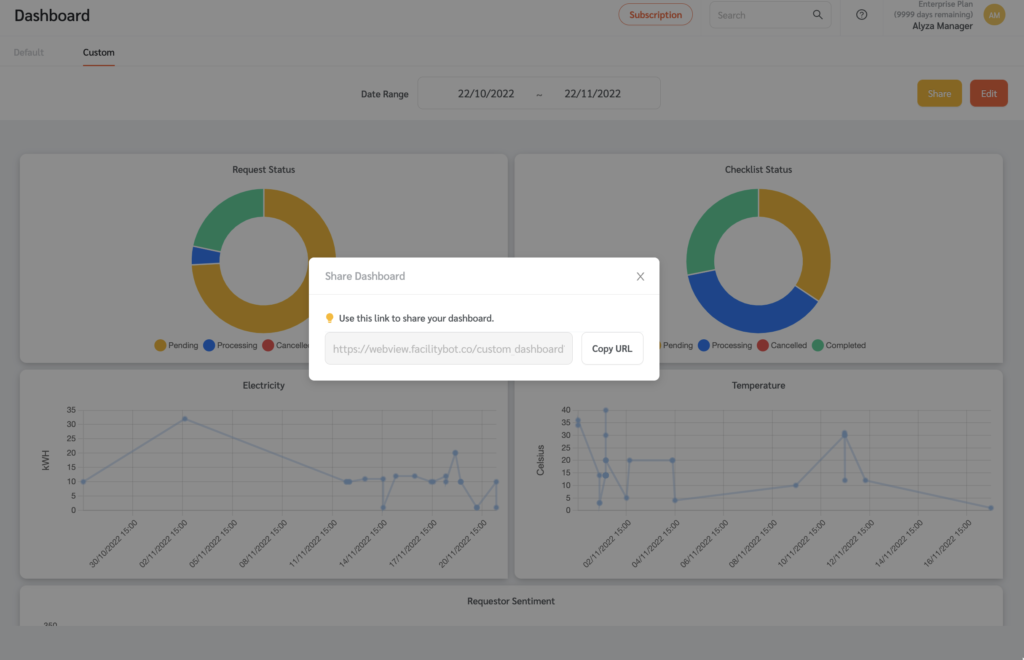
- Copy the URL and paste it on the browser to see the webview.