The Desk Statistics charts and tables aggregate the desk booking data.
- To access this data, log in to FacilityBot Portal. Click on Statistics then Desk Statistics.
- This data can be filtered by Date Range. You can also view the data in Daily or Monthly periods
- Once the filter has been selected, click on the “Apply Filter” button.
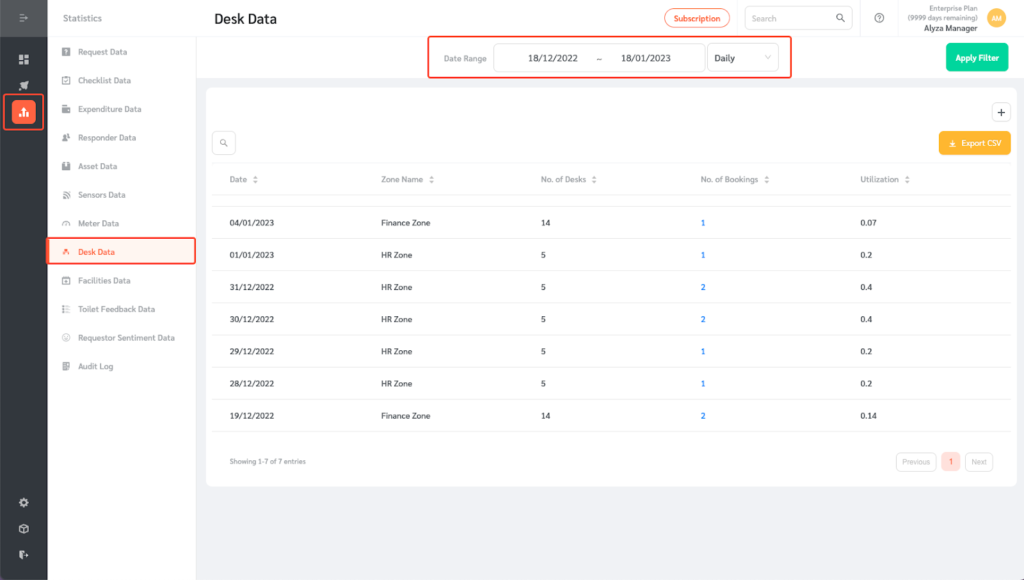
- The table shows the breakdown by date.
- Here, you can view the zone name and number of desks in a zone. It also shows the number of desk bookings received and the utlization rate.
- The numbers in blue are clickable to view the desk bookings in question.
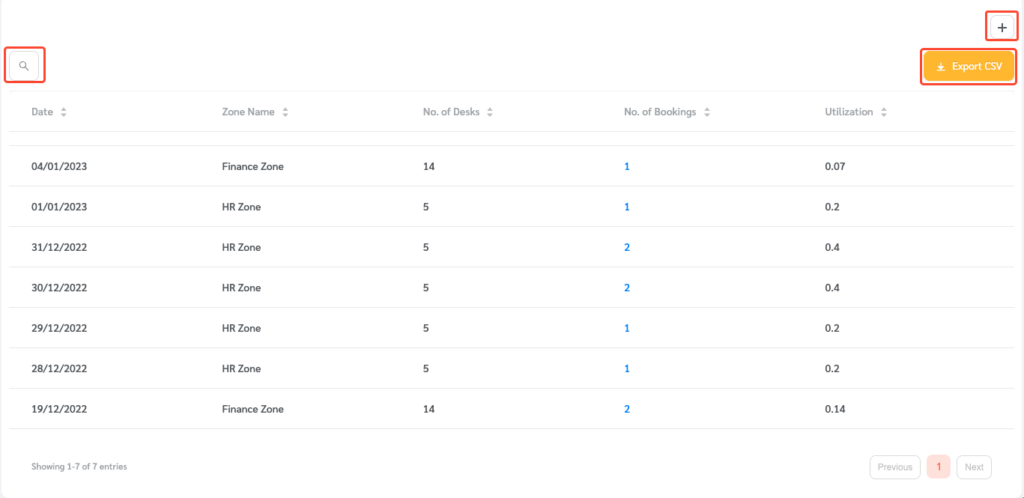
- Use the search field to search for a specific Zone.
- The table can also be exported as a CSV file using the Export CSV button.
- Click on the Plus icon to add the table to a custom dashboard.
