The Expenditure Statistics charts and tables aggregate the expenditures incurred.
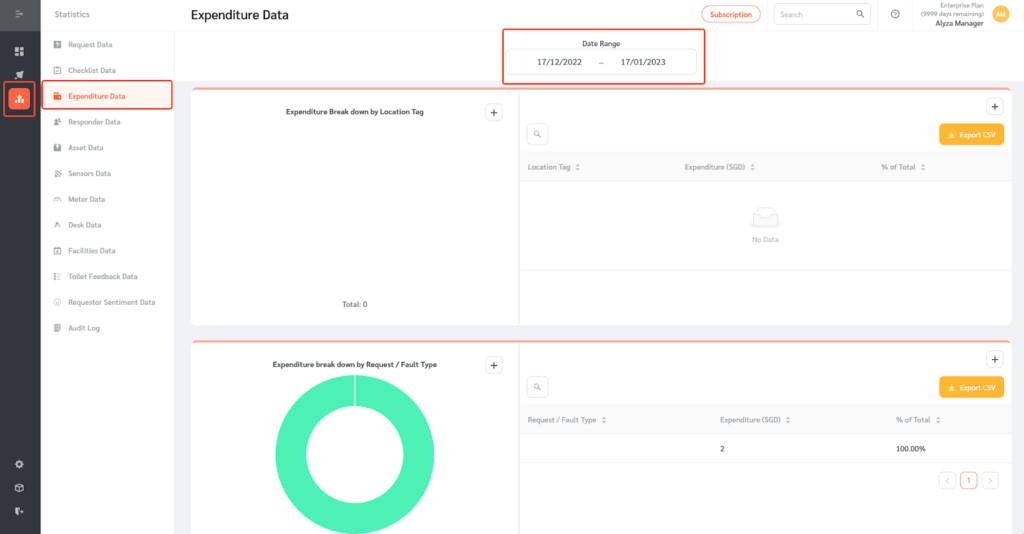
- To access this data, log in to FacilityBot Portal. Click on Statistics then Expenditure Statistics.
- This data can be filtered by Date Range.
Expenditure Breakdown
Expenditures are broken down by Location Tag, Request/Fault Type, and SOR Name.
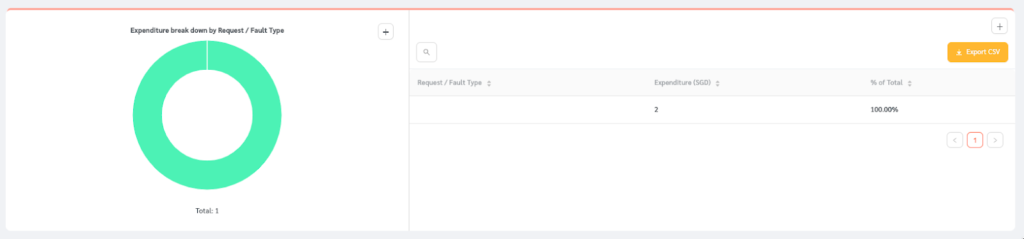
- The left-hand side shows the pie chart and the table view is shown on the right.
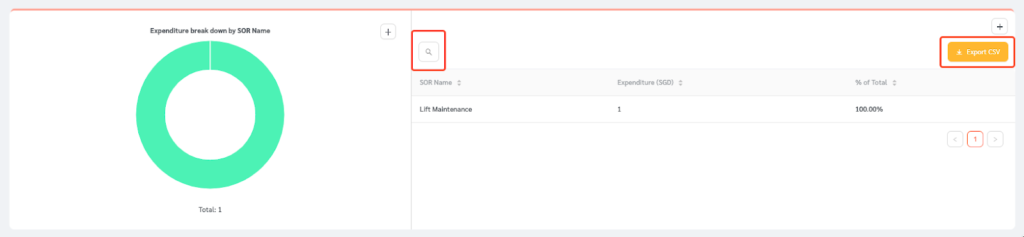
- Search for a specific expenditure by clicking on the search field.
- Expenditure tables can also be exported as a CSV file by clicking on the Export CSV button.
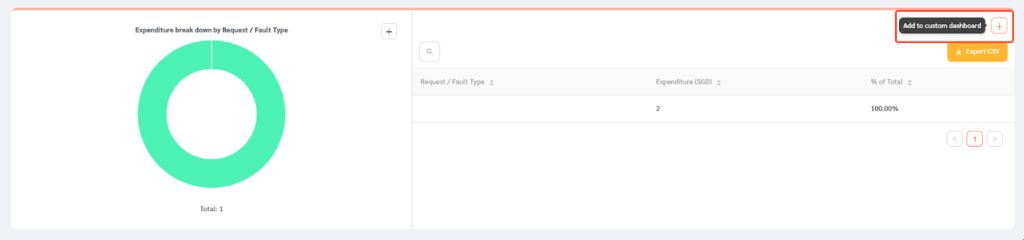
- Expenditure tables can also be added to the Custom Dashboard by clicking on the plus icon on the right.