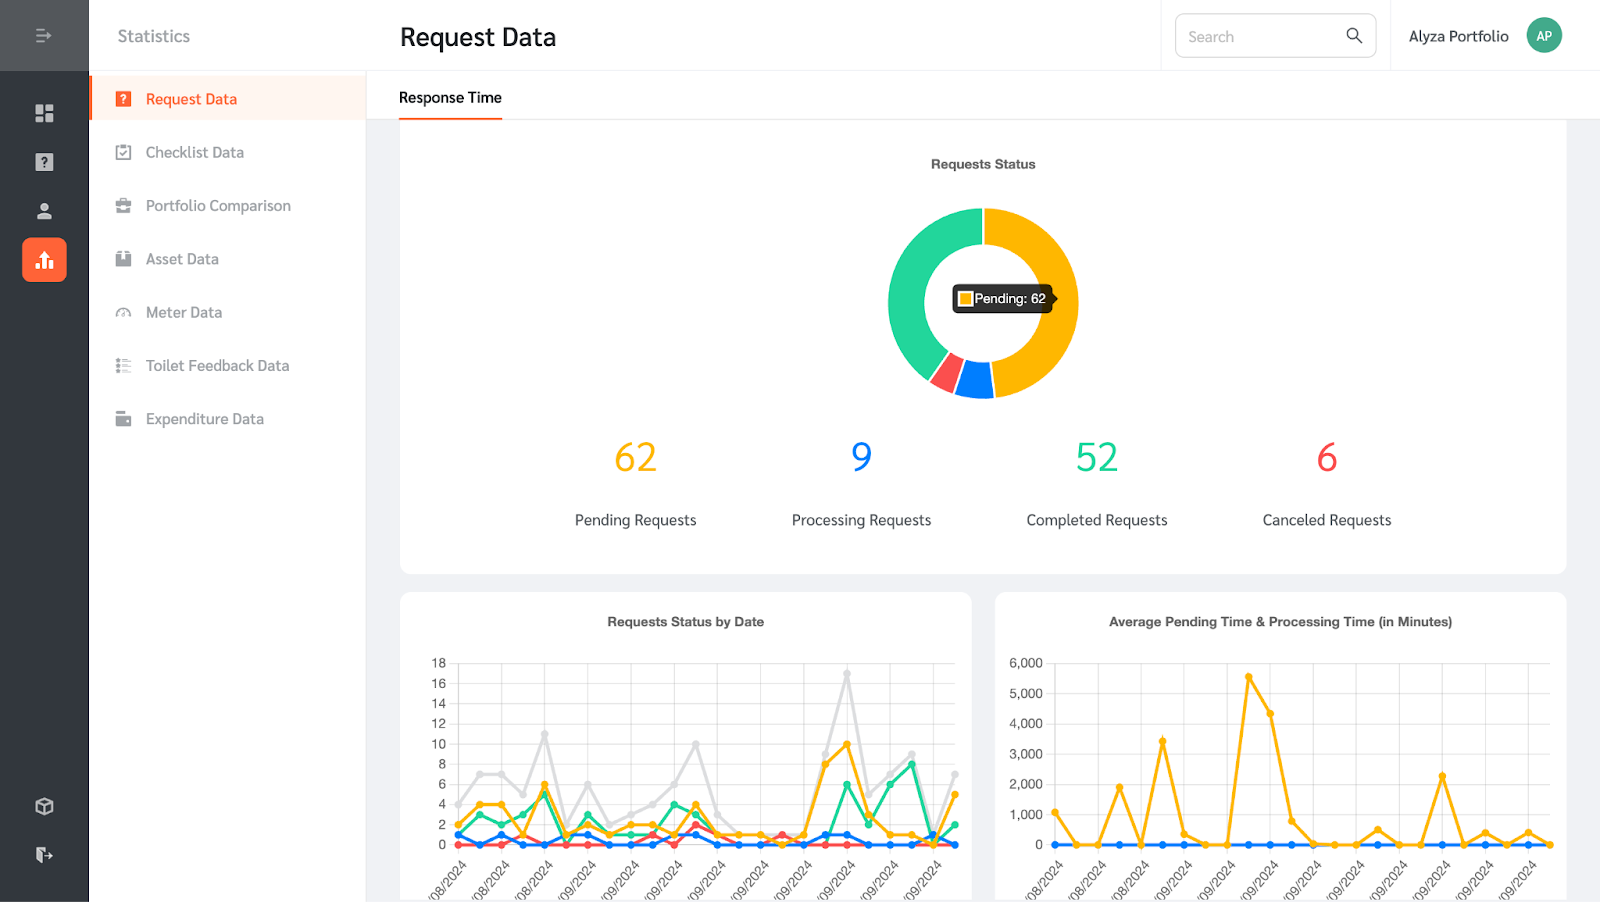
Here, you can view the Request Response Times, Request Breakdowns by different factors, and Request Response times measure versus configurable thresholds (KPIs) set. All data is aggregated from the underlying instances linked to this Portfolio.
- Go to Statistics→Request Data.
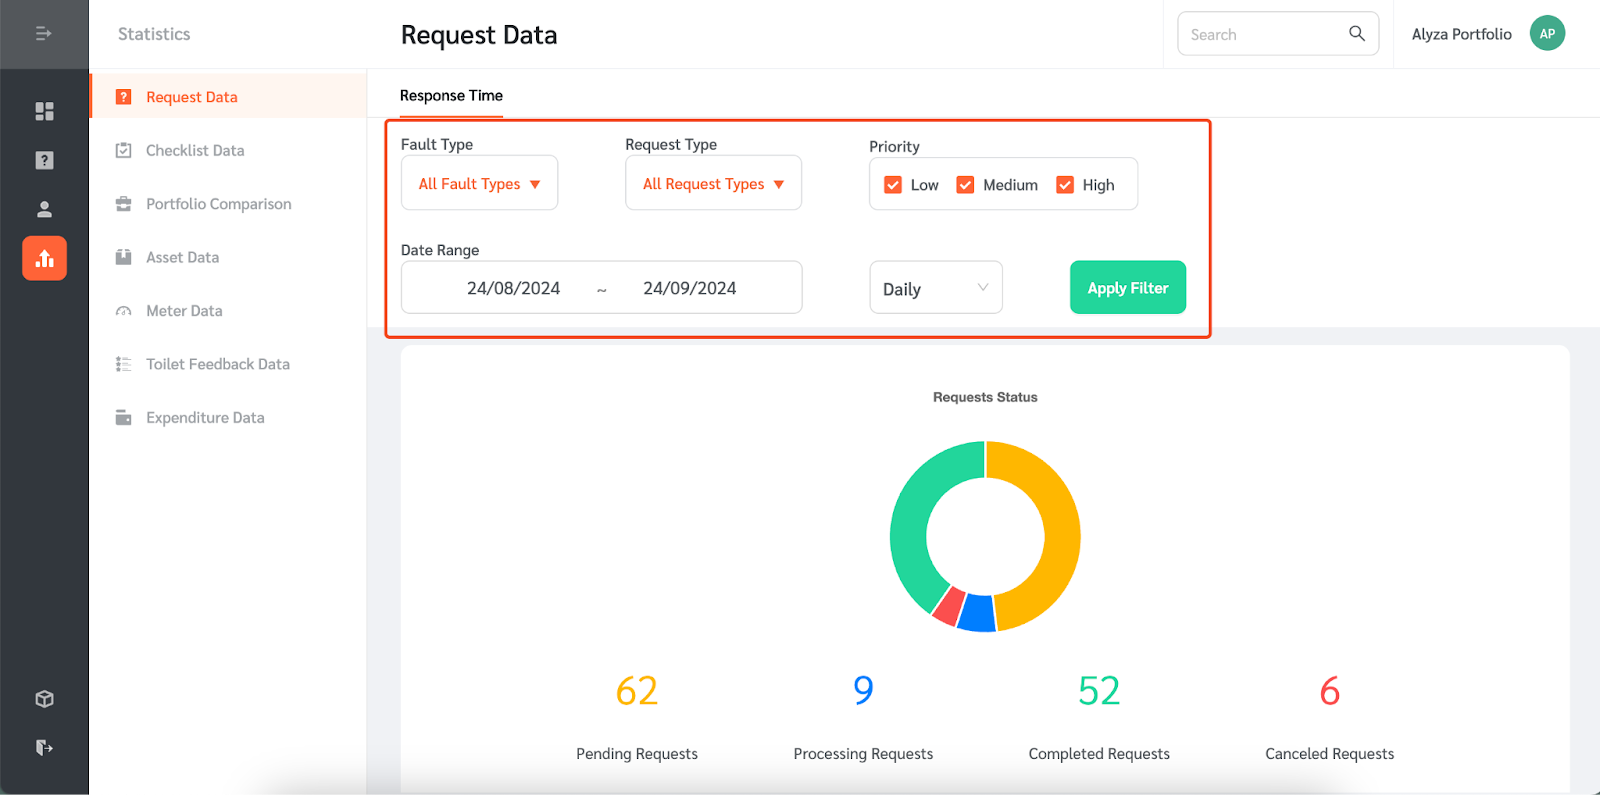
- You can filter the request data using fault type, request type, priority level, and date range.
- Once all the filters have been added click on the “Apply Filter” button.
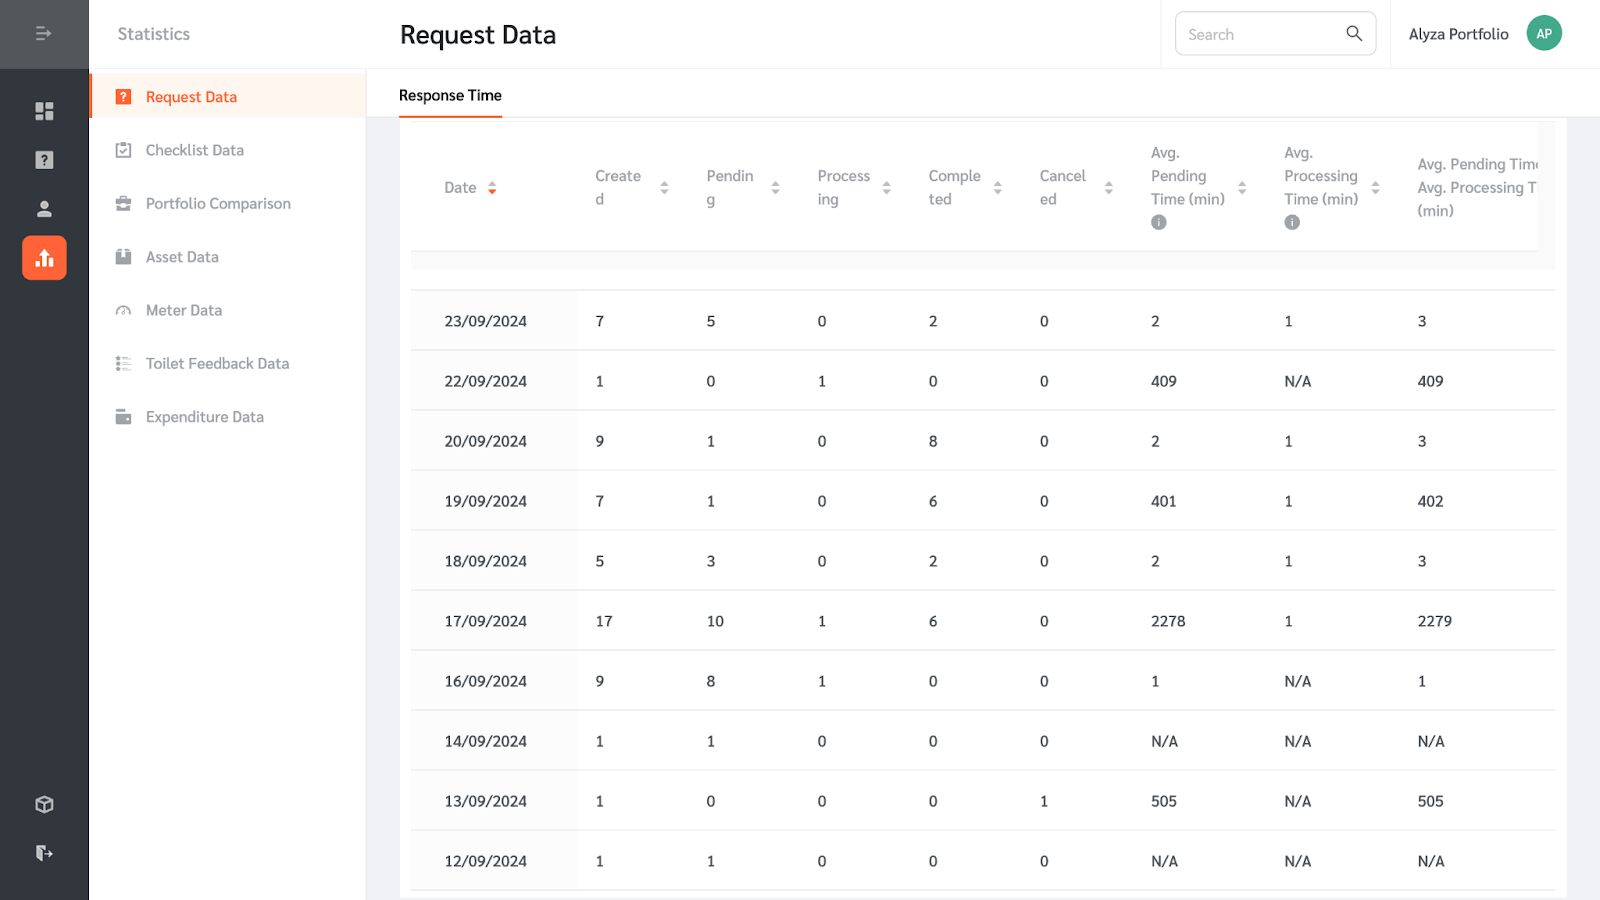
- The response status and response times charts and tables aggregate the current statuses of all requests and their average pending and processing times.
- The average pending time is the average time that requests spend in the “Pending” state
- The average processing time is the average time that requests spend in the “Processing” state