FacilityBot’s Analytics includes Pivot Tables for summarizing and exploring data directly within the platform. Similar to PowerBI, this tool allows users to organize data by key fields like task type, location, or status, making complex datasets easier to understand.
Pivot Tables help facility managers quickly identify trends, track performance, and generate custom reports. With flexible grouping and aggregation options, they offer a powerful way to uncover insights without relying on external software.
Configuring a Pivot Table
To create a Pivot Table in Analytics:
- Log in to the FacilityBot Manager Portal.
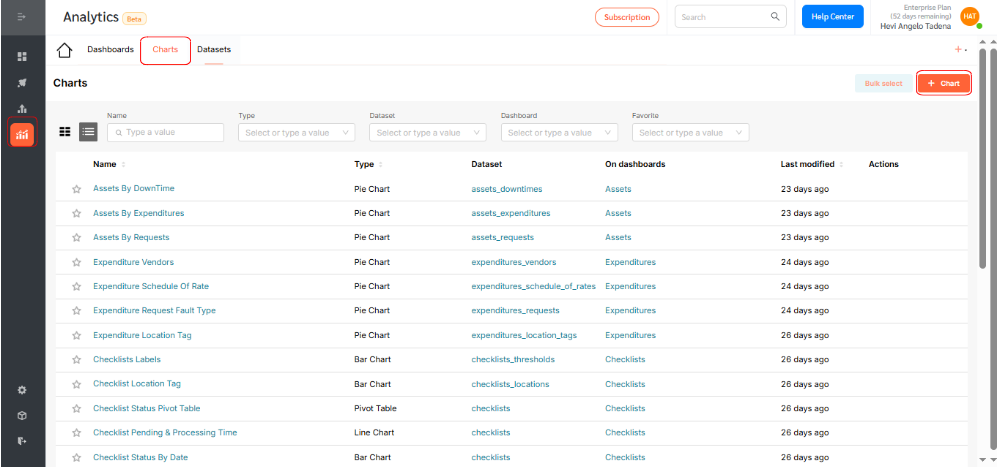
- Navigate to Analytics > Charts, then click the +Chart icon.
- In this walkthrough, we’ll create a Pivot Table that displays the daily count of checklists, grouped by their status.
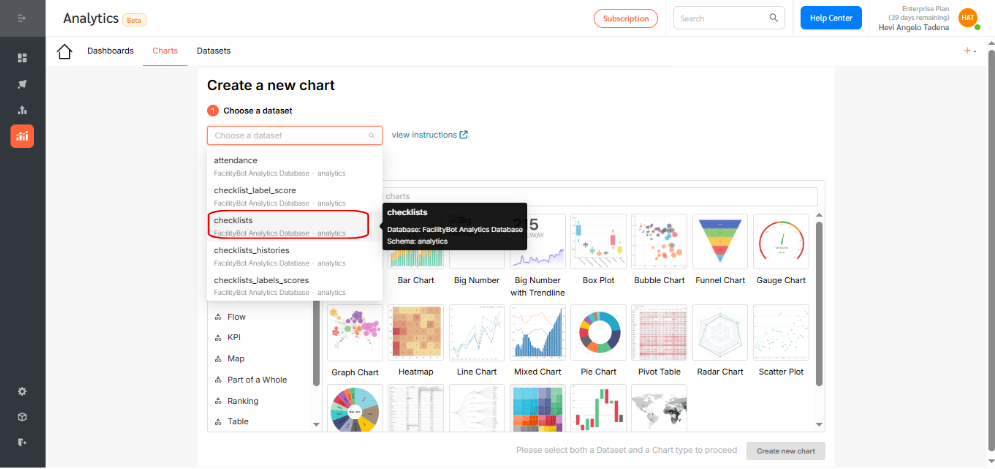
- Choose the dataset for your chart. For this example, select Checklist.
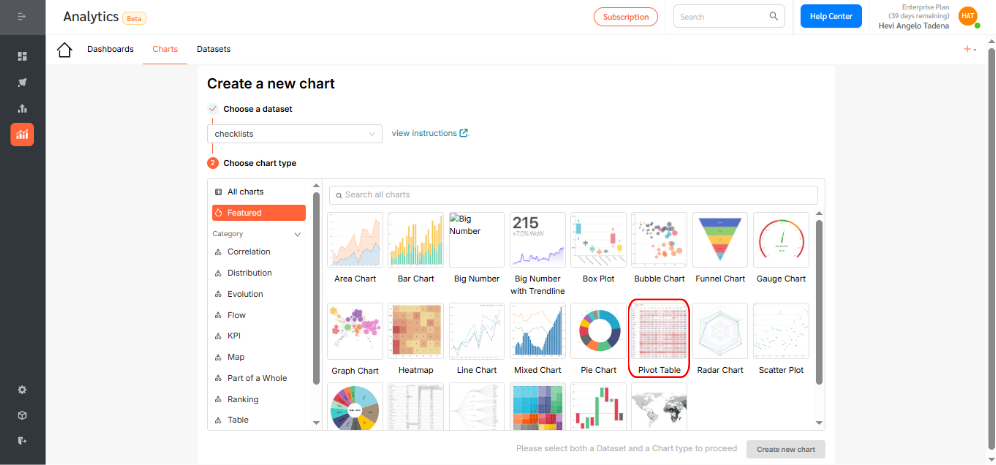
- Click the Pivot Table icon.
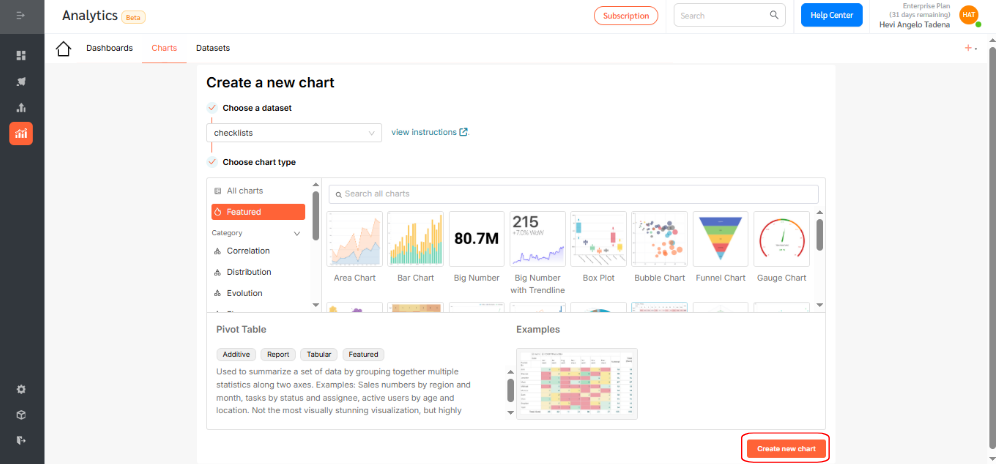
- Then, click Create new chart to proceed.
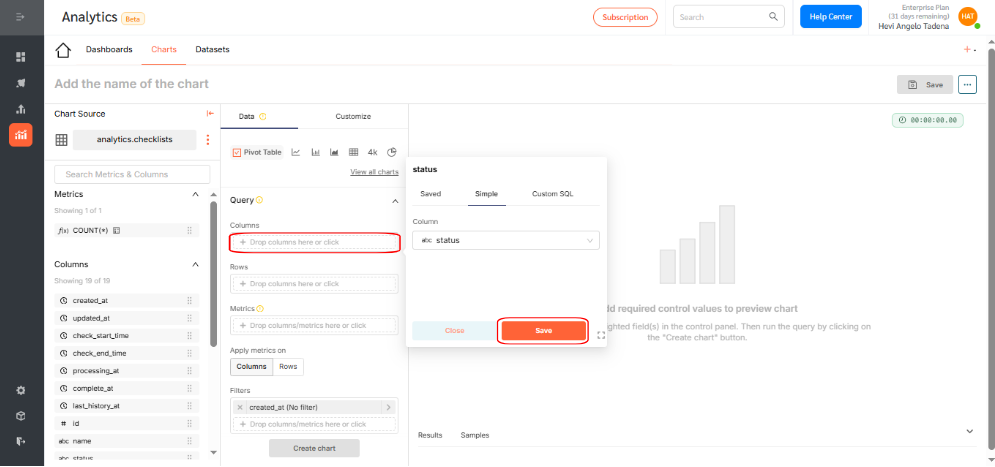
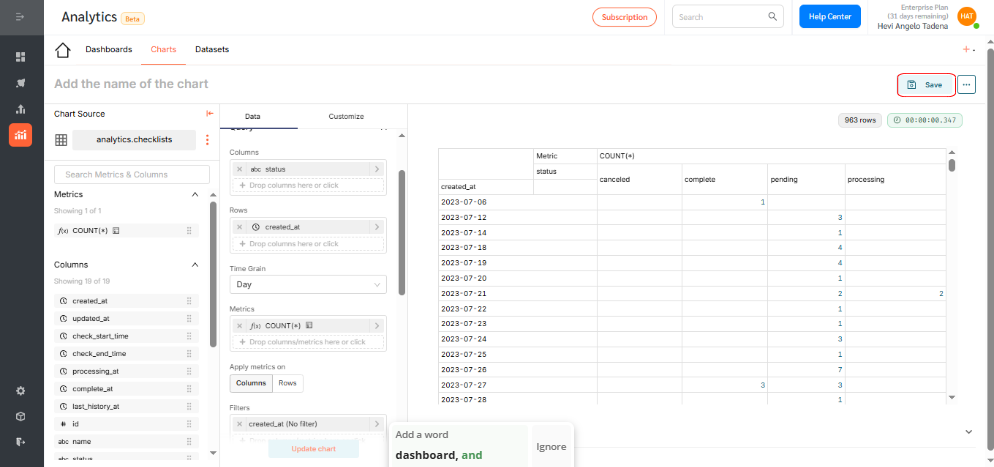
- In the Columns section, select the field you want to use as column headers, then click Save to apply the changes. In the example below, I have selected “Status”.
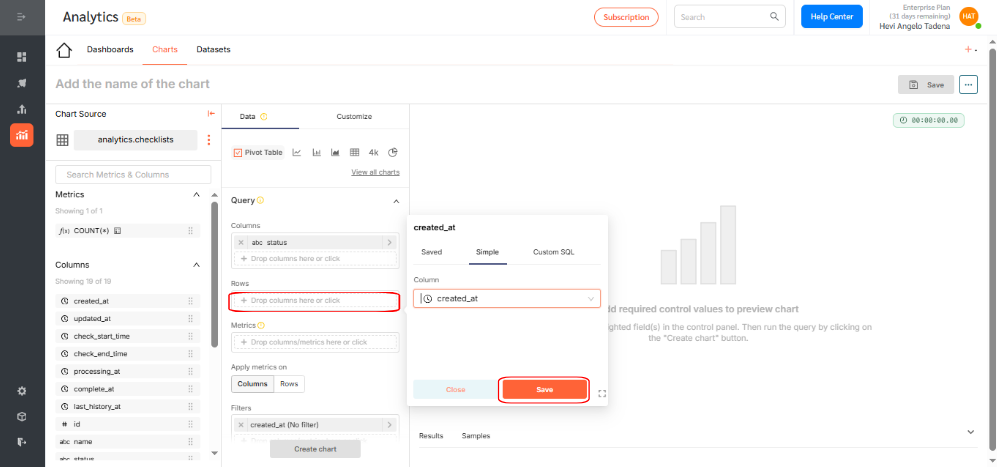
- In the Rows section, select the dataset you want to display in the pivot table, then click Save to apply the changes. In the example below, I have selected “Created At”.
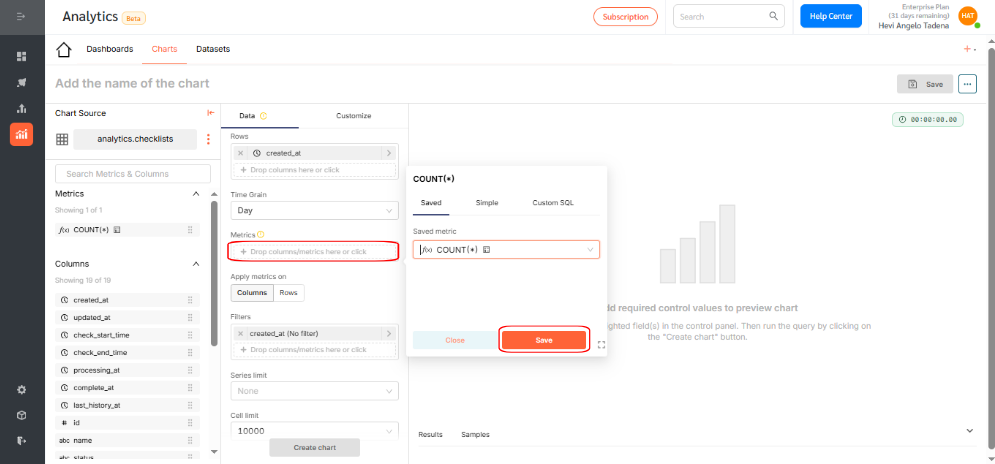
- Select a metric using an aggregation function like count, sum, or average, or write custom SQL for advanced cases. In this example, use count to display the number of checklists, then click Save.
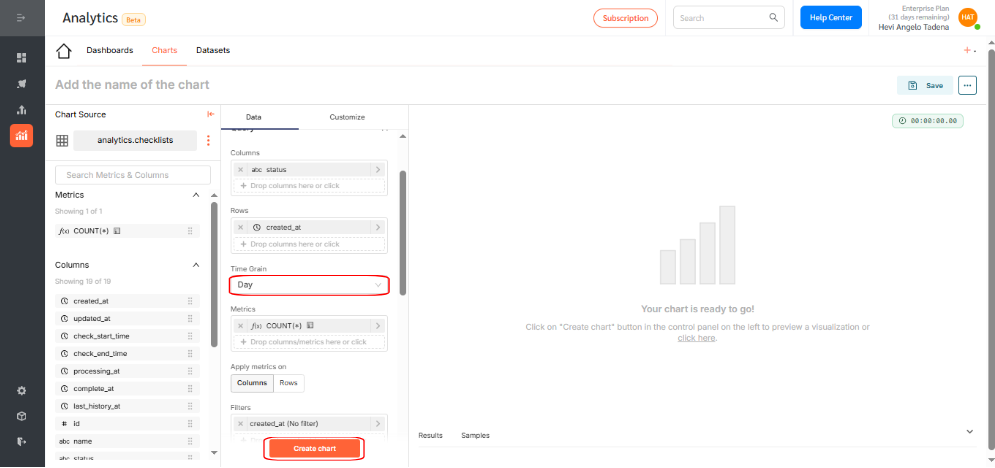
Optionally, adjust the time grain. In this case, set the time grain to daily, then click Create Chart.
- If everything looks correct, click Save. In this example, I have created a table showing the number of checklists created each day with columns for each checklist status.
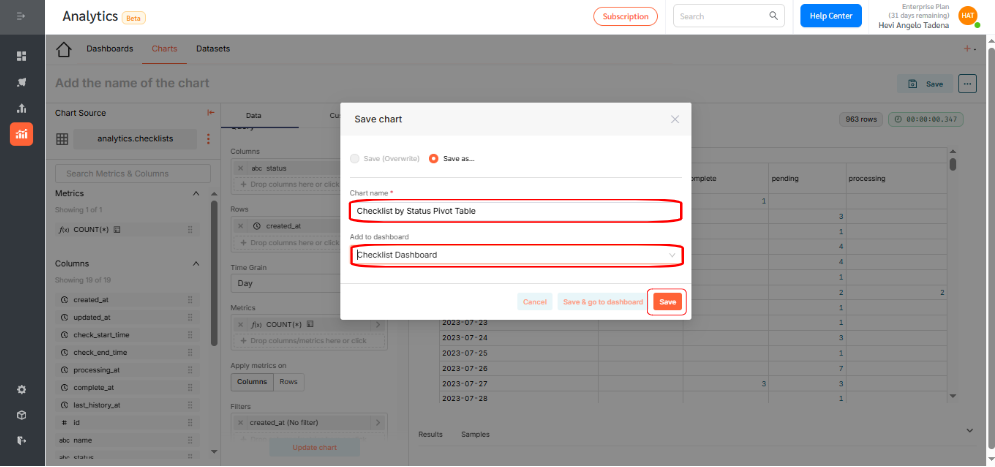
- Name your chart, assign it to a dashboard, then click Save.
Displaying the Pivot Table on a Dashboard
To add your chart to a dashboard:
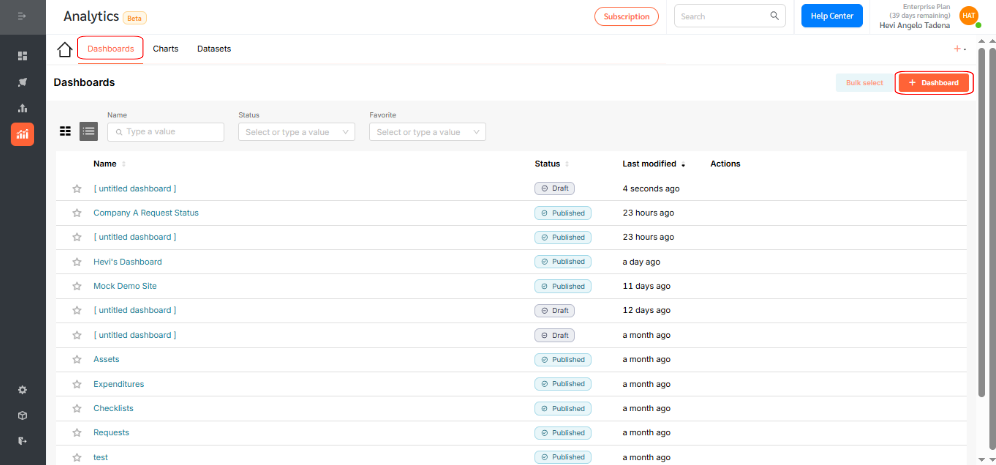
- Go to Dashboards and click +Dashboard.
- Drag your desired chart into the layout.
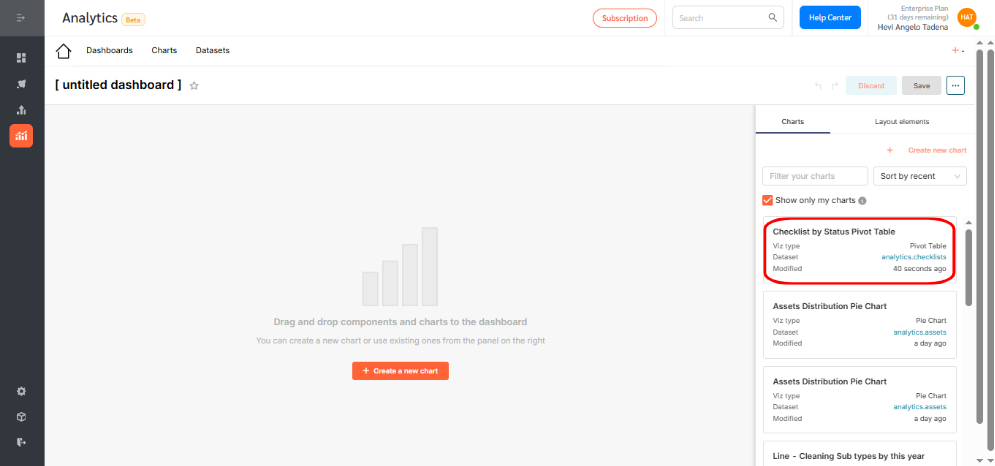
- Resize or reposition as needed.
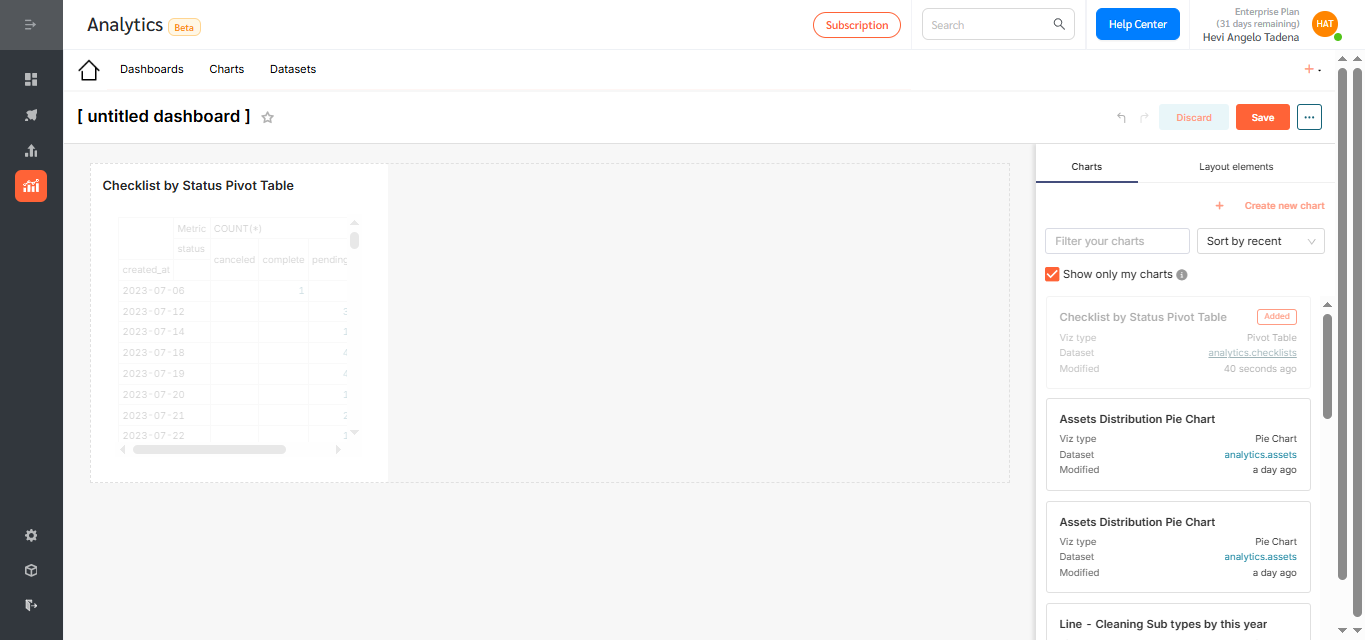
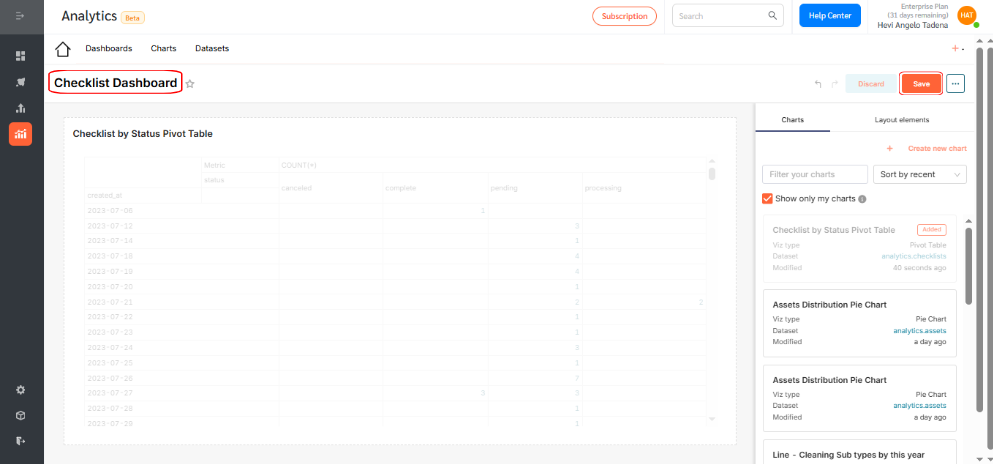
- Rename the dashboard to reflect its purpose and click Save.
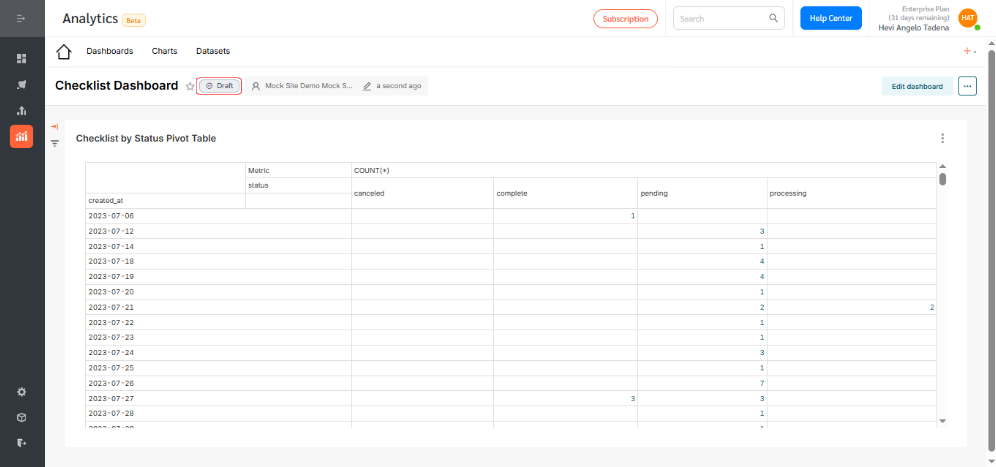
- By default, dashboards are saved as drafts. Click the Draft icon to publish.
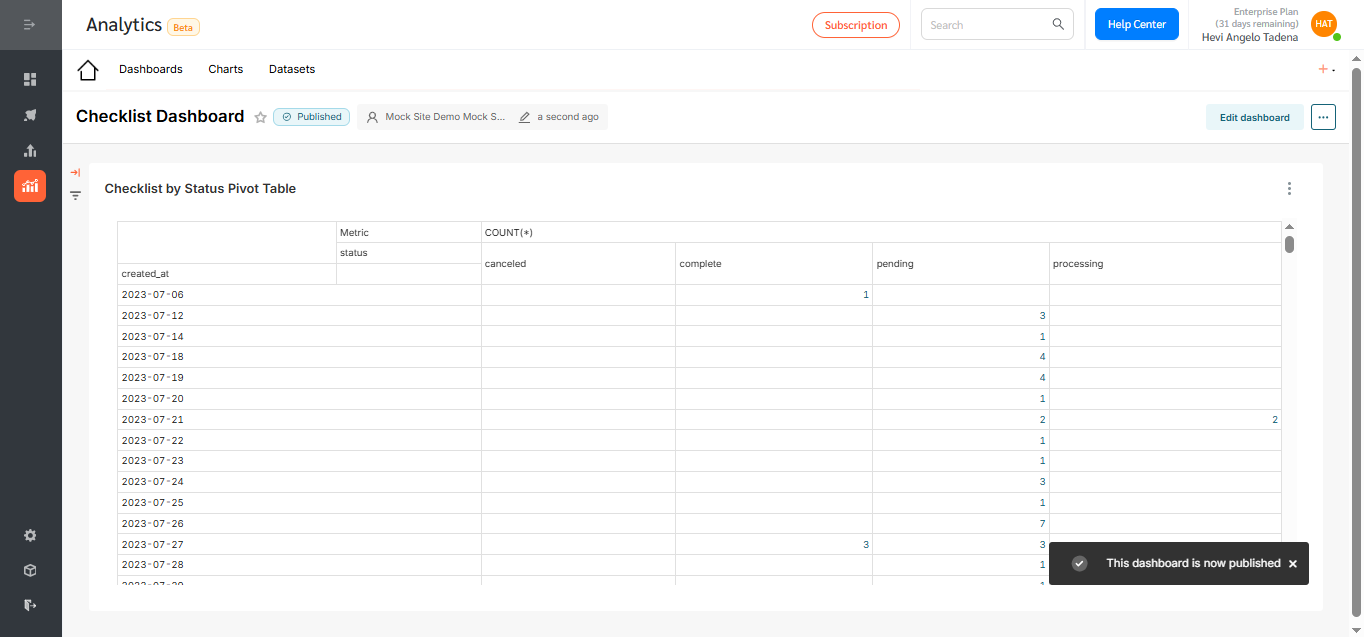
Pivot Tables in FacilityBot Analytics provide a flexible, in-depth way to summarize and explore data from multiple angles. Use them to break down complex information, compare performance across categories, and generate actionable insights—all seamlessly within the FacilityBot ecosystem.
