- The Checklist Statistics charts and tables aggregate the current statuses of all checklists and their average pending and processing times.
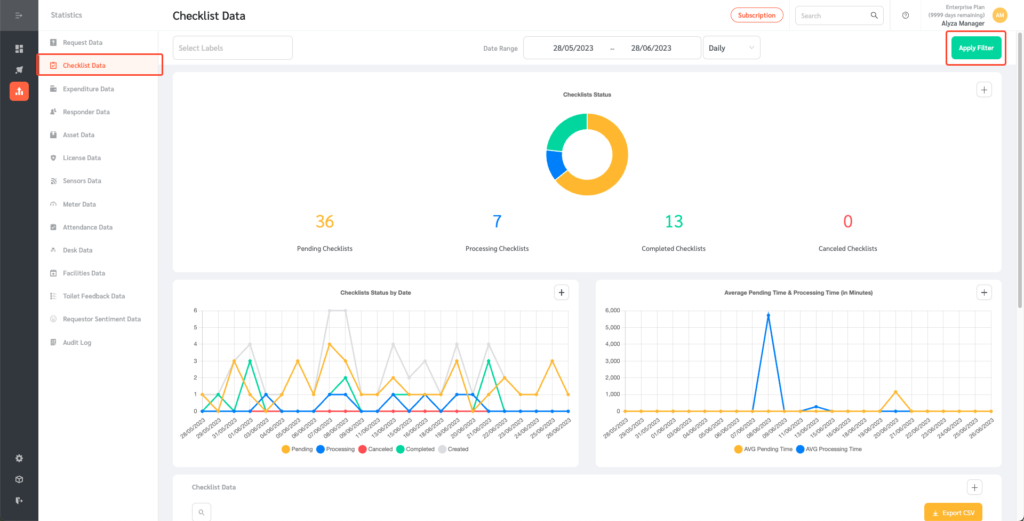
- This data can be filtered by Date Range. You can also view the data in Daily or Monthly periods
- Once the filter has been selected, click on the “Apply Filter” button.
Checklist Data Table
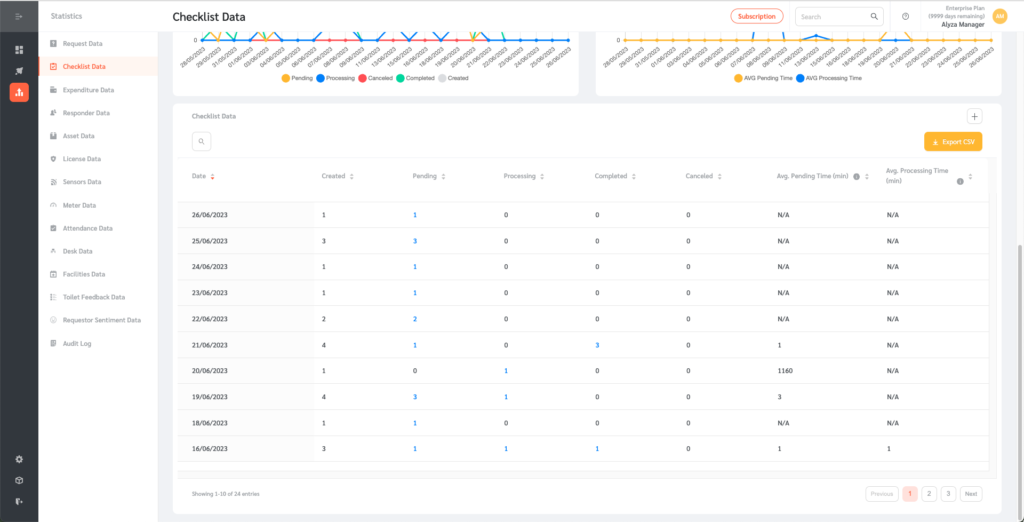
- The Checklist Data Table shows checklist statuses in a table format. The numbers in blue can be clicked to show the checklists in question.
- The Checklist Data can also be exported as a CSV file by clicking on the ”Export CSV” button.
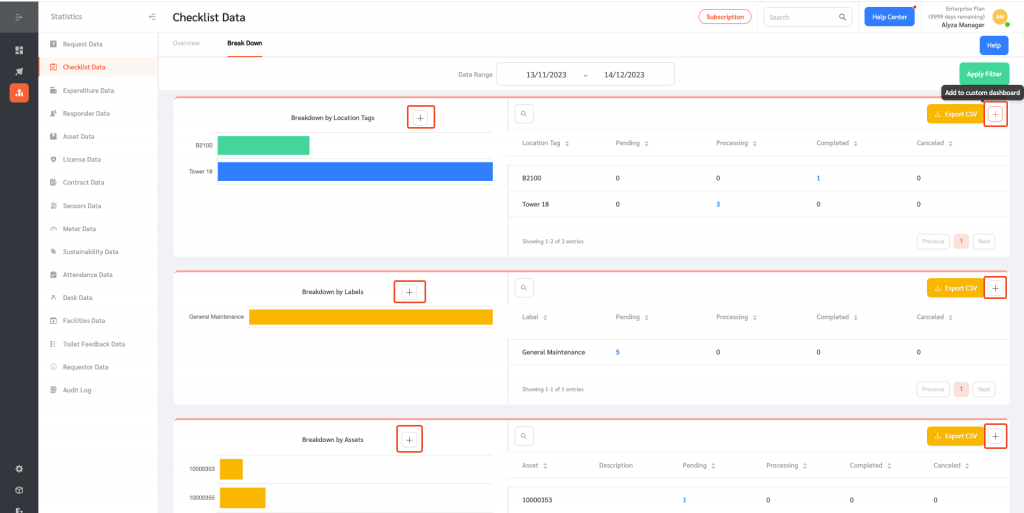
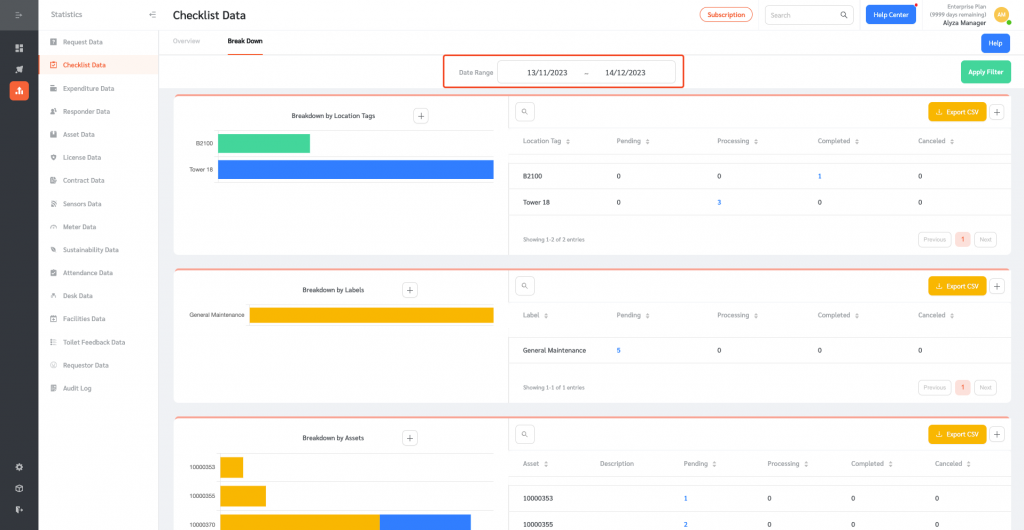
Checklist Data Breakdown
- On this page, Checklists data is broken down based on Location Tags, Labels, and Assets linked to the checklists.
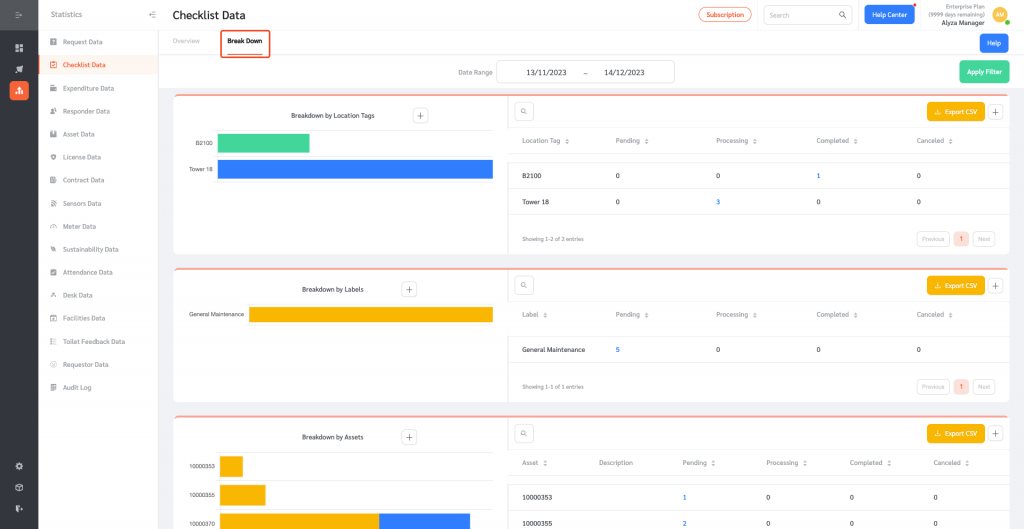
- The data can be filtered using a date range.
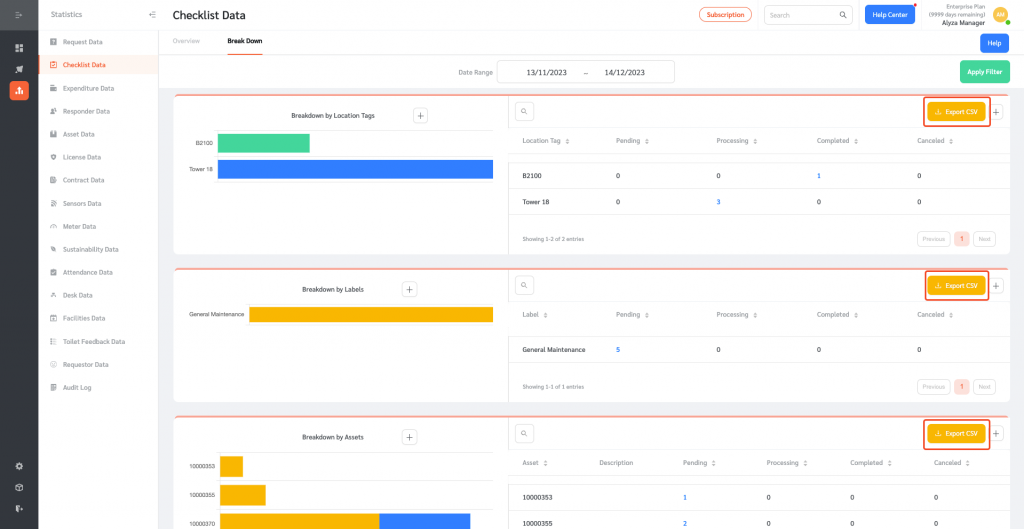
- The Checklists data breakdowns can also be exported as CSV by clicking on the “Export CSV” on top of each table.
- The Checklist breakdown tables and charts can be added to a Custom Dashboard by clicking on the plus icons.