Introduction
FacilityBot now includes Chart Generator, a Generative AI–powered feature that transforms your available meter data into dynamic, customizable visualizations. Instead of manually exporting data and building charts externally, you can simply describe the chart you want in plain language—and let AI generate it instantly.
Chart Generator analyzes your selected meter data and produces clear, visual representations such as line charts, bar charts, stacked charts, and histograms. It enables teams to quickly identify trends, anomalies, averages, and distribution patterns—making data interpretation faster and more intuitive.
Using Chart Generator
To generate charts in FacilityBot:
- Log in to the FacilityBot Web Portal.
- Navigate to Statistics, then Meter Data.
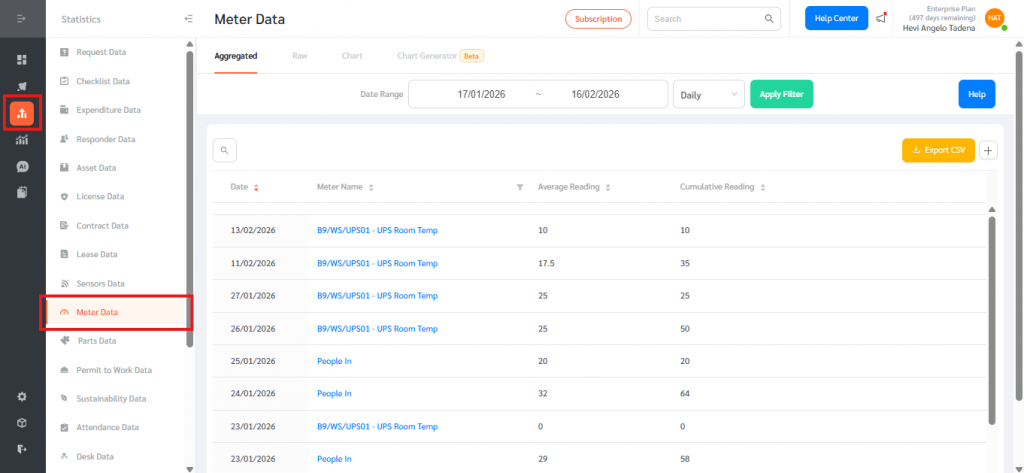
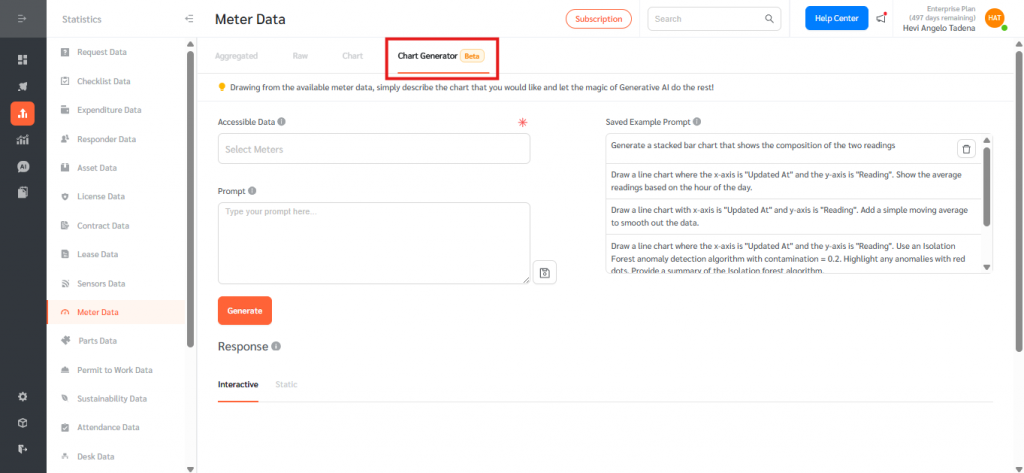
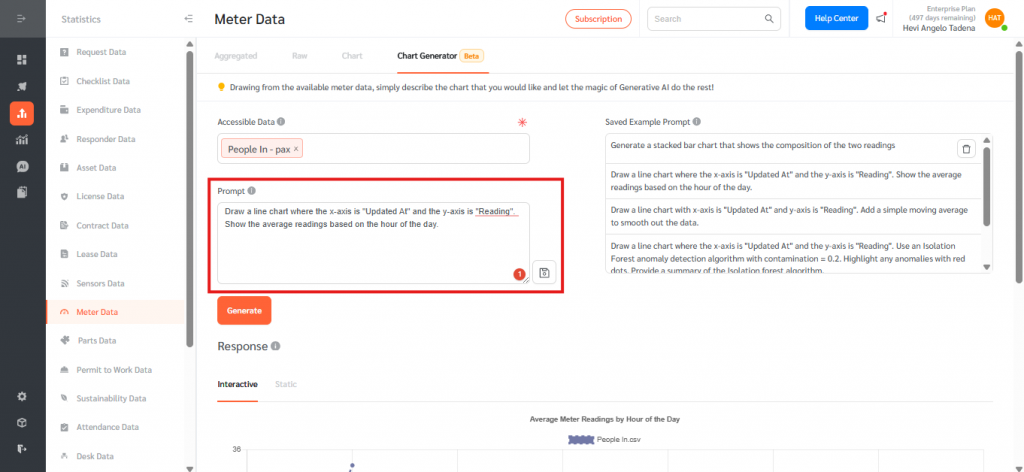
- Open the Chart Generator tab.
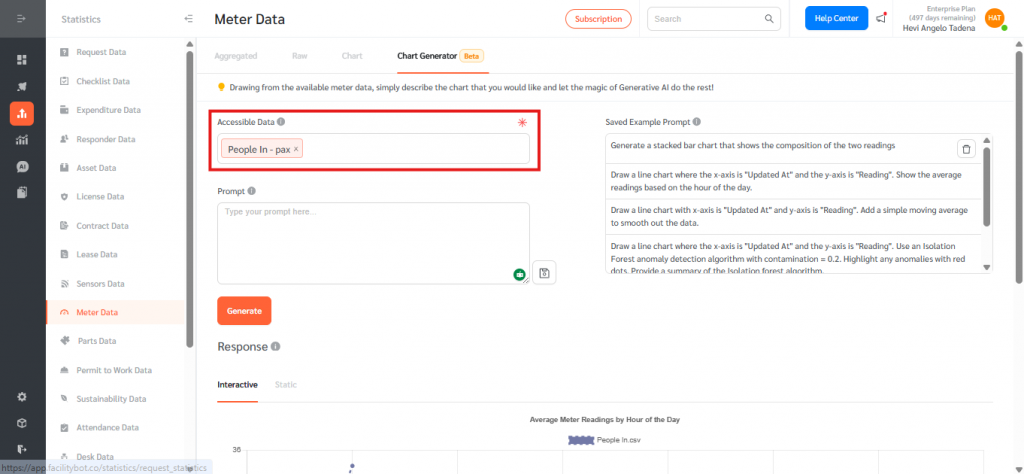
- Select the meter data for which you want to generate a chart.
- In the Prompt field, describe the chart you would like to generate using natural language.
- Example:
Draw a line chart where the x-axis is “Updated At” and the y-axis is “Reading”. Show the average readings based on the hour of the day.
- Example:
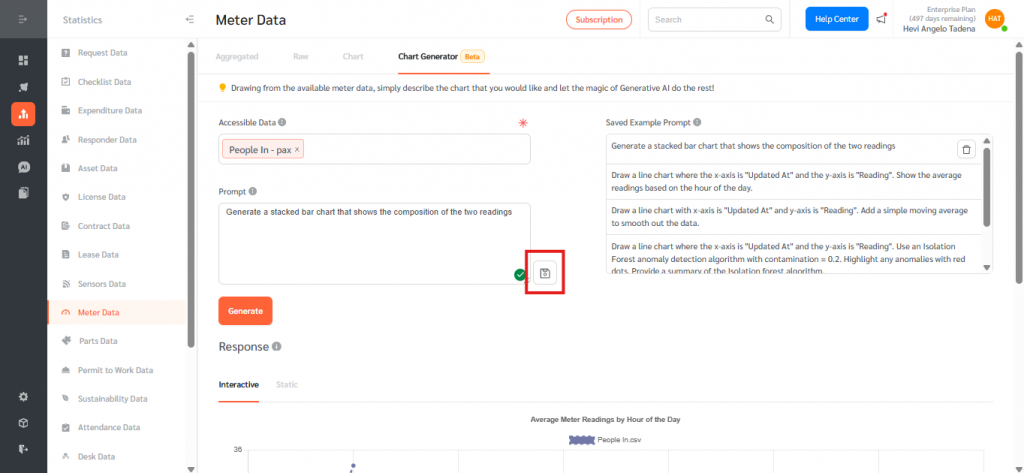
- You may also select from Saved Example Prompts as a starting point, such as:
- Generate a stacked bar chart that shows the composition of the two readings.
- Draw a line chart with x-axis “Updated At” and y-axis “Reading”. Add a simple moving average to smooth out the data.
- Draw a line chart and use an Isolation Forest anomaly detection algorithm (contamination = 0.2). Highlight anomalies with red dots and provide a summary of the algorithm.
- Plot a histogram with mean and standard deviation indicators.
- Generate a stacked bar chart that shows the composition of the two readings.
- Click Generate to create the chart.
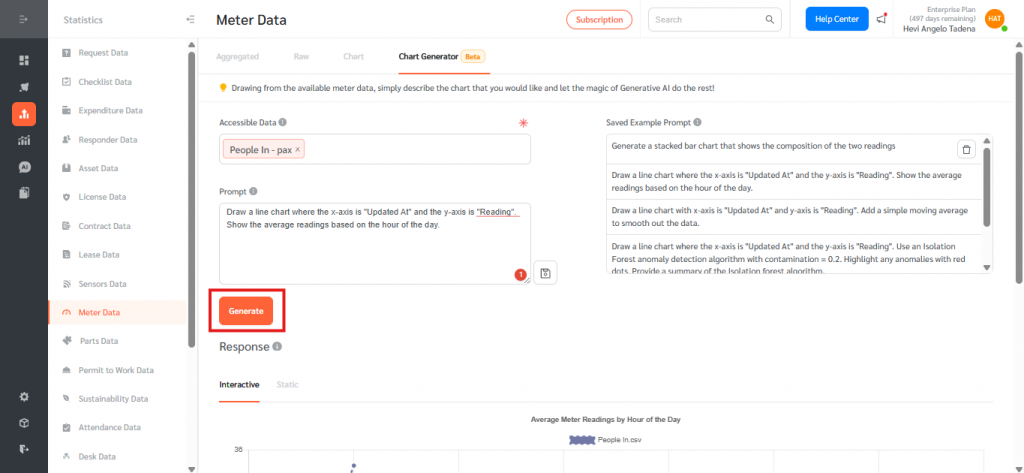
- FacilityBot will display the AI-generated chart along with any requested analytical summary.
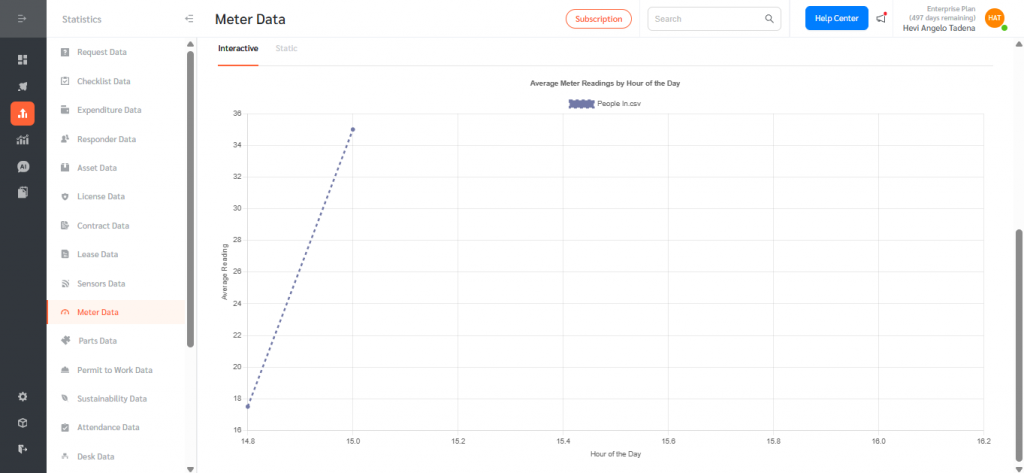
Interactive and Static Views
Generated charts may be viewed in:
- Interactive Mode – Allows zooming, hovering for data values, and dynamic exploration.
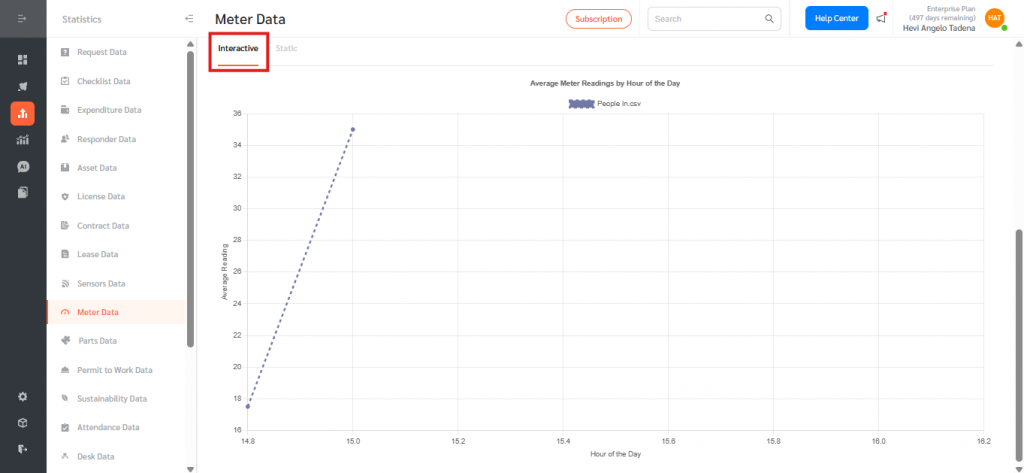
- Static Mode – Provides a fixed visual snapshot suitable for reporting or documentation.
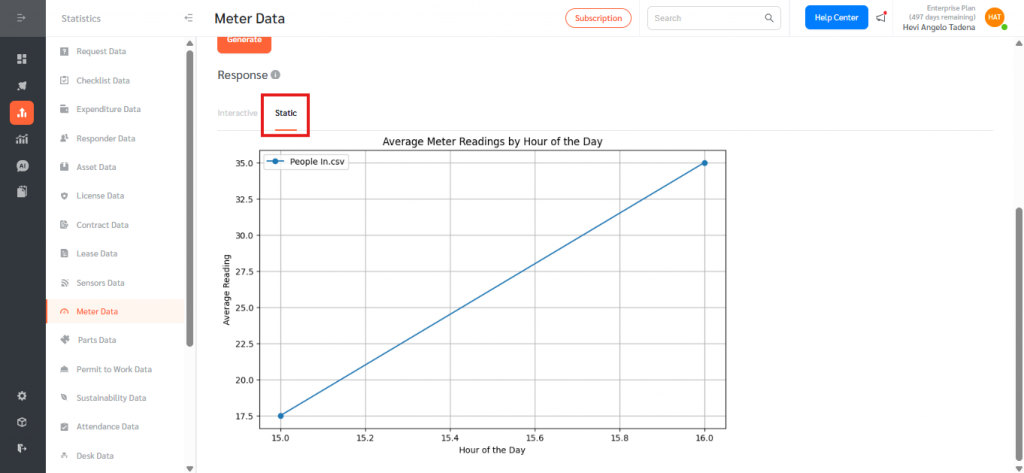
Chart Generator streamlines meter data analysis by turning raw readings into clear, actionable visual insights—without the need for manual exports or spreadsheets. It automatically highlights trends, averages, and anomalies while supporting data-driven decision-making. With flexible, natural-language prompts and AI-powered visualization, teams can efficiently analyze and understand meter performance directly within FacilityBot.
