
Introduction
FacilityBot supports Gaussian cleaning robots through the Sensors integration. Each Gaussian robot is configured as a sensor using the robot’s serial number as its MQTT Topic. When a robot completes a cleaning run, FacilityBot receives its cleaning report, including area covered, cleaning efficiency, run time, completion rate, water usage, and cleaning location. The data can be linked to Meters for historical tracking and trending, used in Workflows and Reports, and visualised in the Gaussian Bot tab of the Robot Dashboard in Analytics.
How It Works
Create a Sensor for the Gaussian Robot
- Log in to the FacilityBot Web Portal.
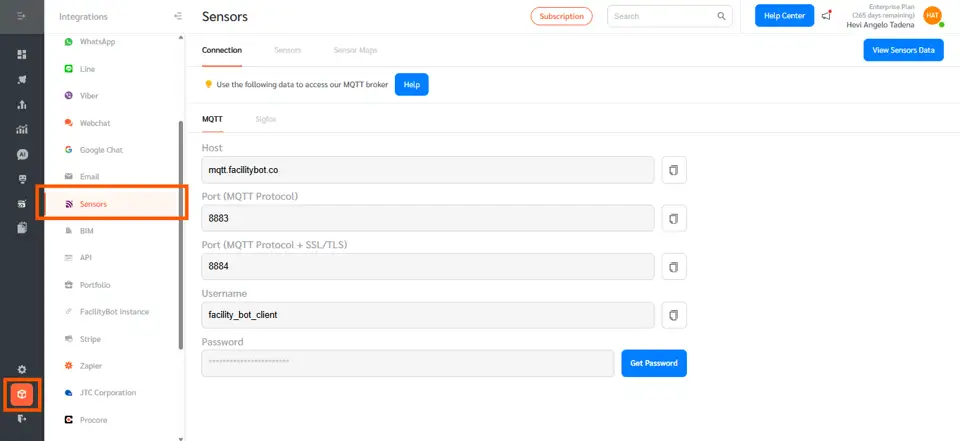
- In the left navigation, click Integrations, then Sensors.
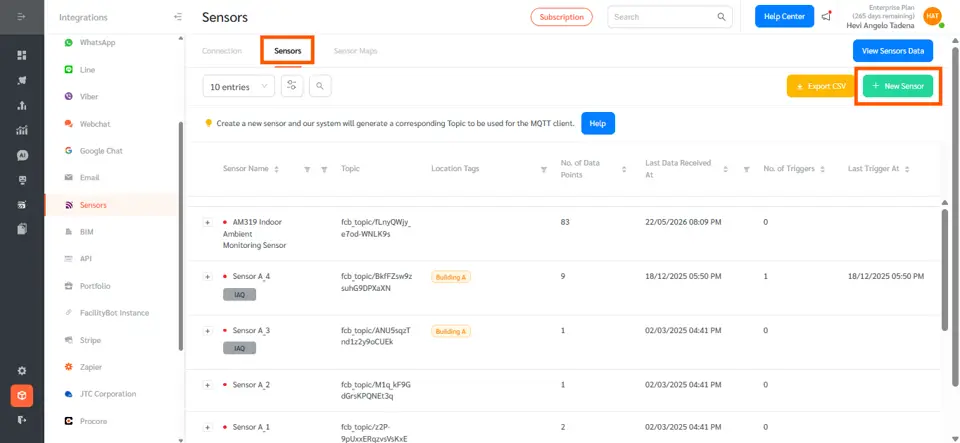
- Click the Sensors tab, then click the green + New Sensor button at the top right.
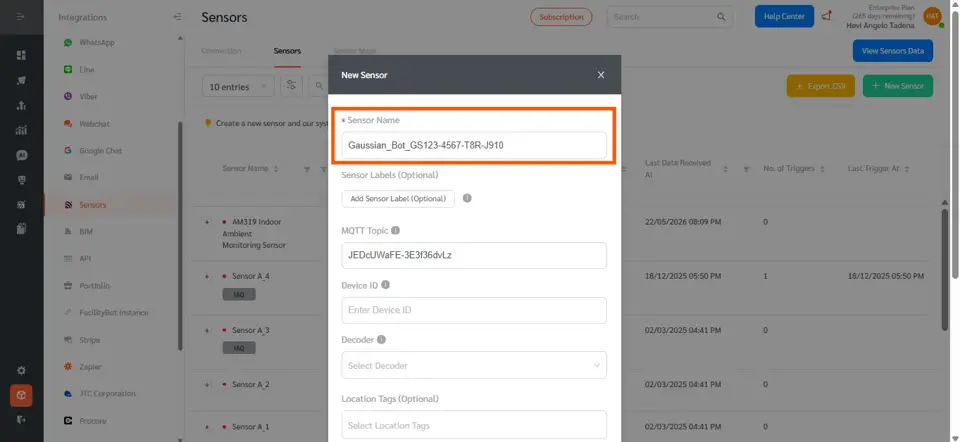
- Enter a Sensor Name that identifies the robot. Including the serial number makes it easy to recognise, for example Gaussian_Bot_GS123-4567-T8R-J910.
- Under Sensor Labels, click Add Sensor Label and add the Robot label so all robot sensors can be filtered and identified at a glance.
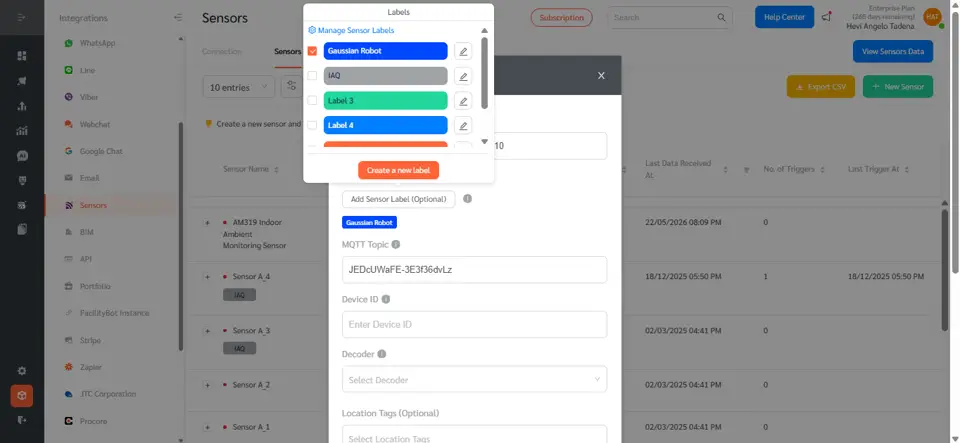
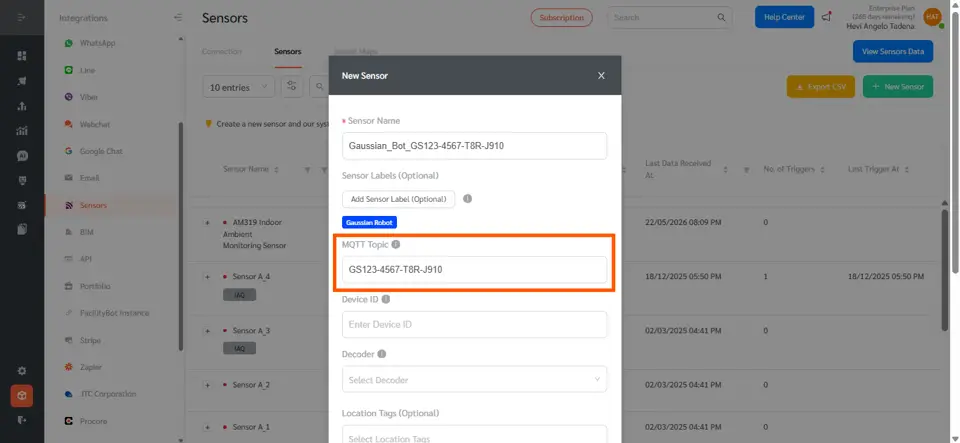
- In the MQTT Topic field, enter the Gaussian robot’s serial number (for example, GS123-4567-T8R-J910). FacilityBot uses this topic to route the robot’s cleaning reports to this sensor, and displays it in the sensor list as fcb_topic/<serial number>. Leave Device ID (used only for SigFox sensors) and Decoder blank, as Gaussian data arrives already in readable form.
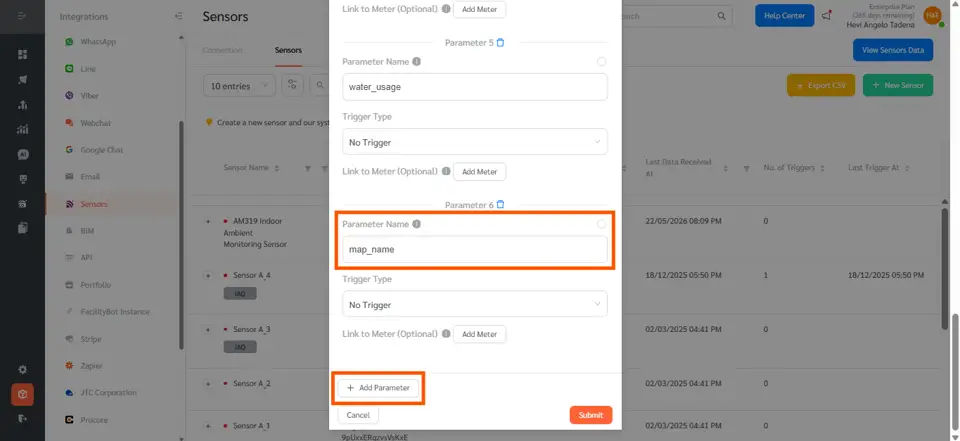
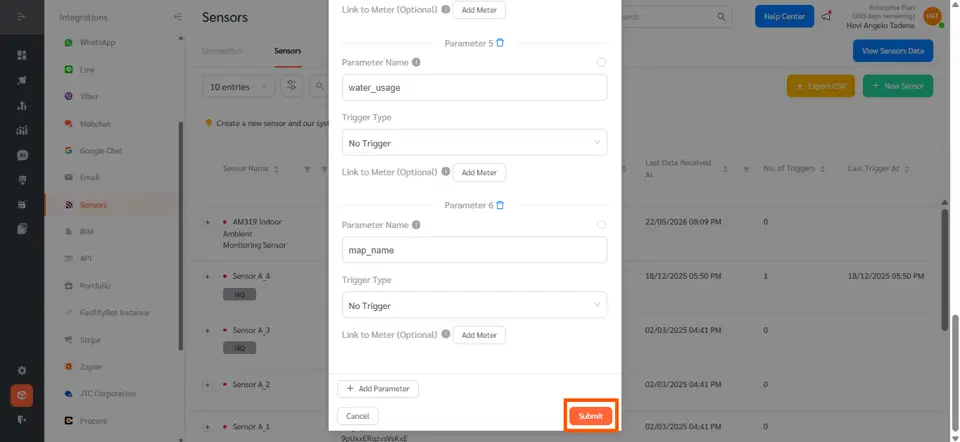
- Click Add Parameter and add one parameter for each data point you want to track. The Parameter Name must match the field name in the robot’s report exactly: area_covered, completion_rate, run_time, efficiency, water_usage, and map_name.
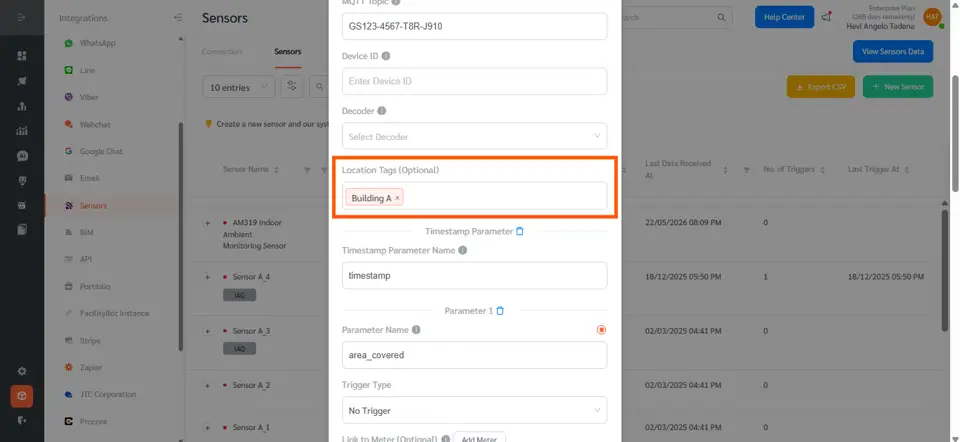
- Optionally, select Location Tags for the sensor, then click Submit.
Verify That Robot Data Is Coming In
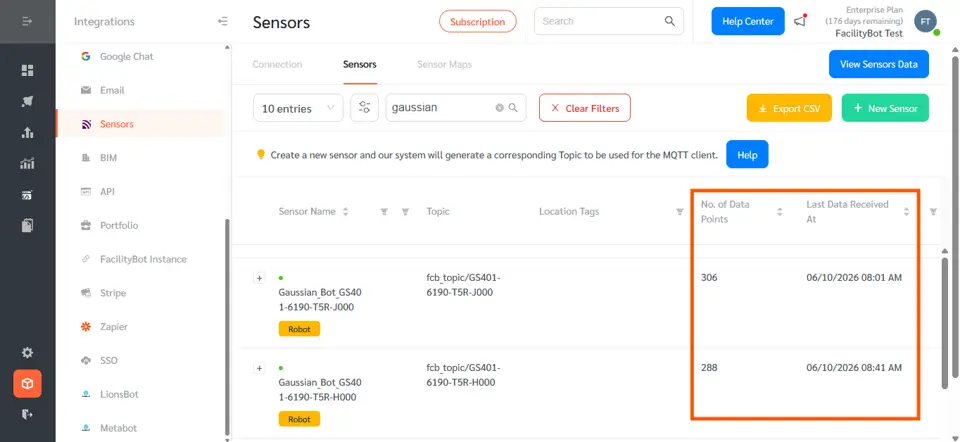
- In the Sensors list, find the robot’s sensor and check the No. of Data Points and Last Data Received At columns. These update each time the robot sends a cleaning report.
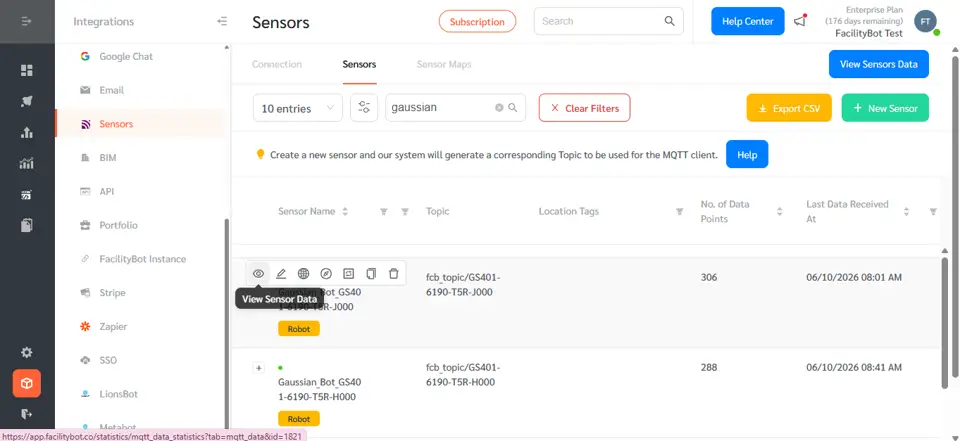
- Click View Sensors Data at the top right, open the Raw tab, and search for the robot’s sensor name.
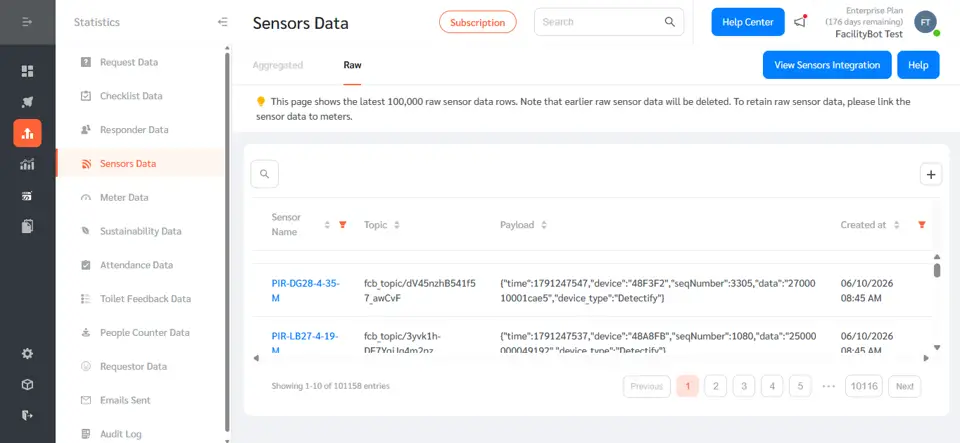
- Each row’s Payload shows the cleaning report received from the robot, including area_covered, map_name, water_usage, efficiency, run_time, completion_rate, and timestamp. Note that only the latest 100,000 raw rows are kept, so link the parameters to Meters to retain the history.
Link Robot Data to Meters
- Go to Features, then Meters.
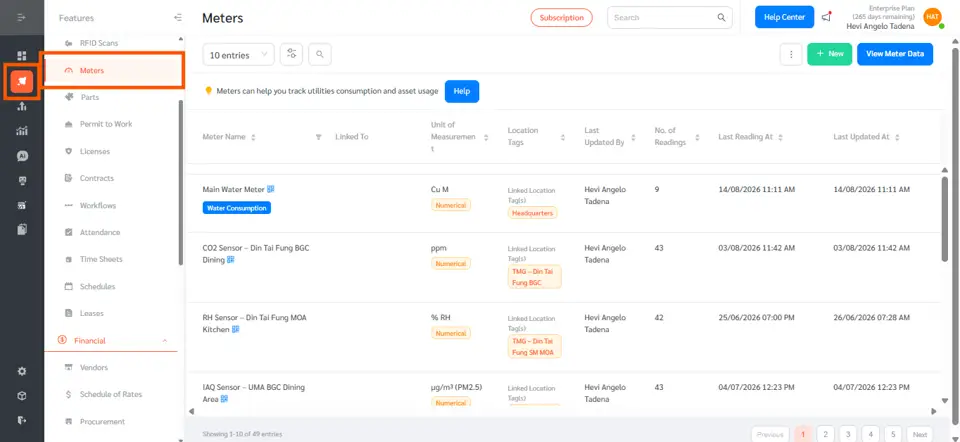
- Click + New to create a meter for a specific robot data point, such as completion rate.
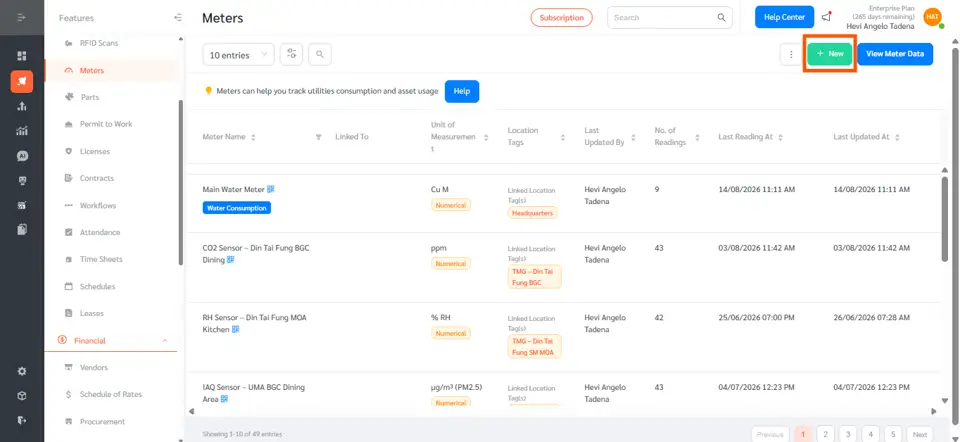
- Enter the Meter Name, Unit of Measurement, and Reading Type. For example, use Numerical with unit “%” for completion_rate, “m²” for area_covered, or “m²/h” for efficiency. For map_name, which records the location cleaned, use Categorical.
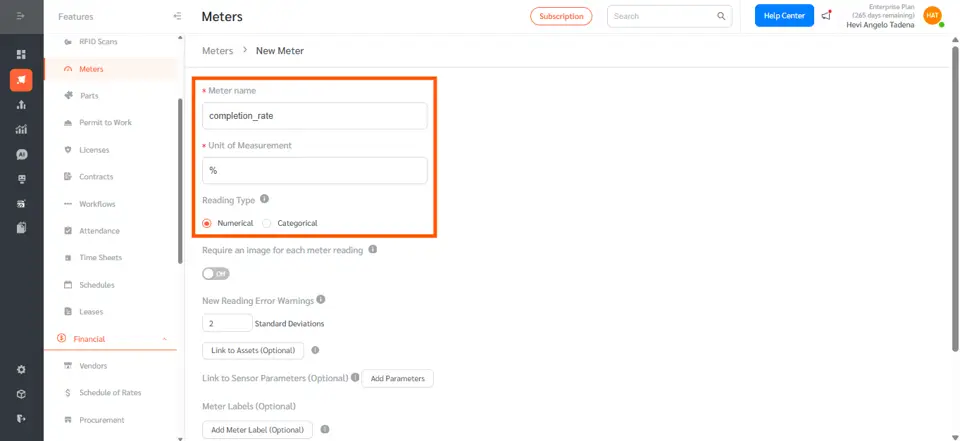
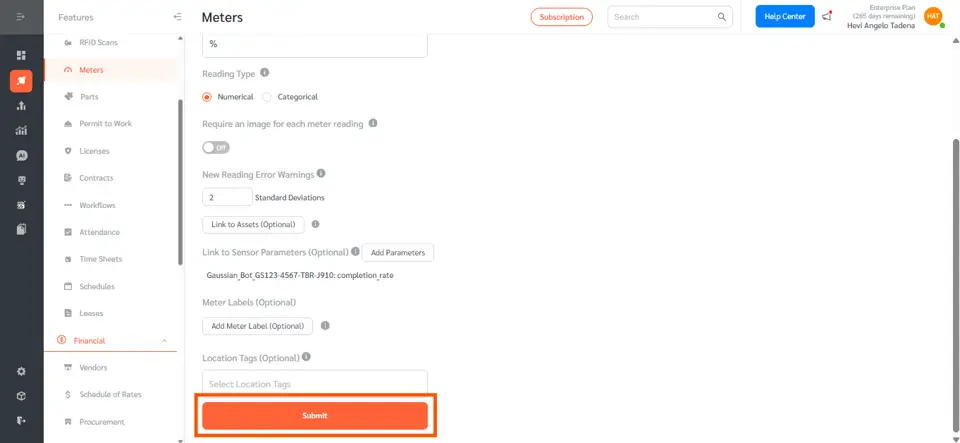
- In Link to Sensor Parameters, click Add Parameters and select the robot’s sensor and parameter — for example, Gaussian_Bot_GS401-6190-T5R-J000: completion_rate.
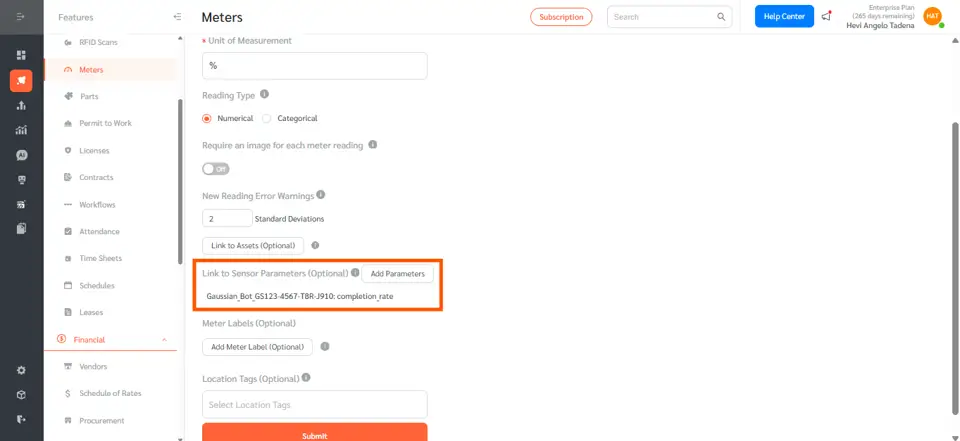
- Click Submit. The meter now populates automatically each time the robot sends a cleaning report. Repeat for each data point you want to trend.
View Robot Performance in the Analytics Dashboard
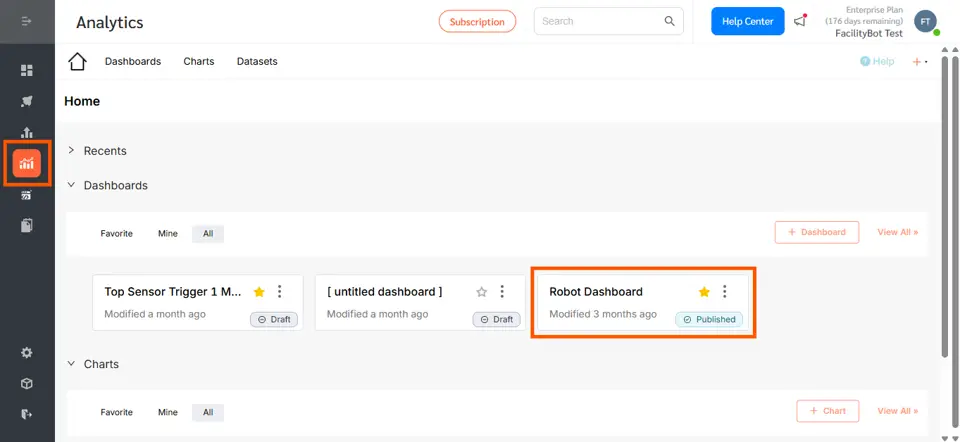
- In the left navigation, click Analytics, open the Dashboards tab, and click Robot Dashboard.
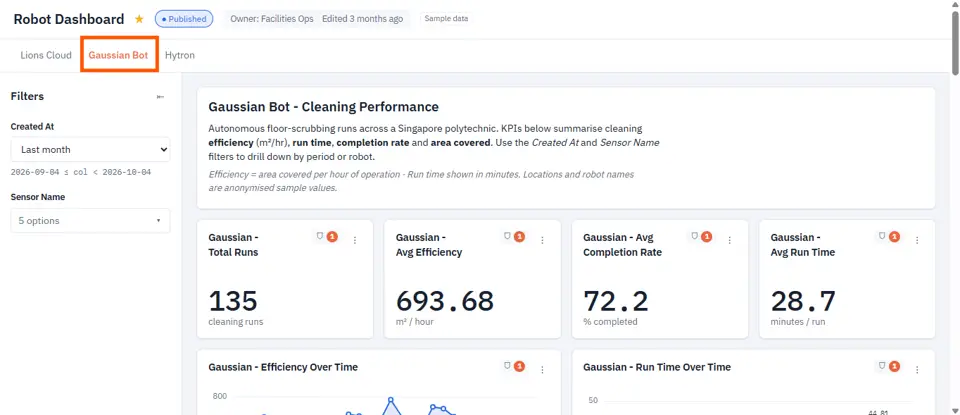
- Click the Gaussian Bot tab to view your Gaussian fleet’s cleaning performance.
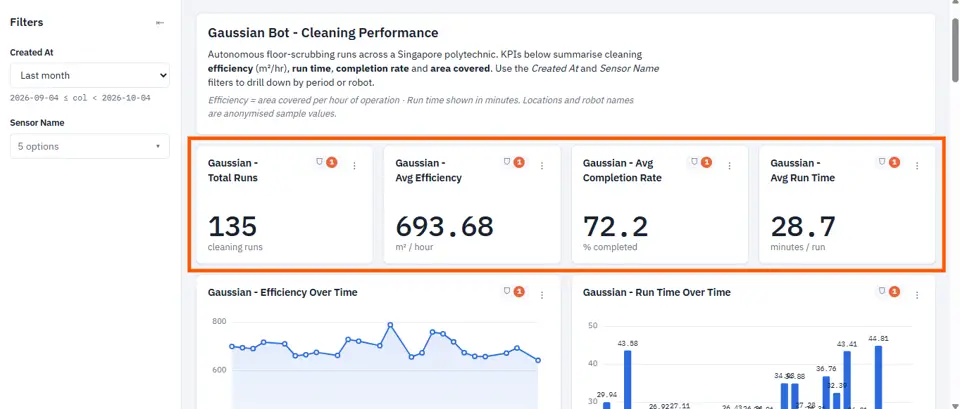
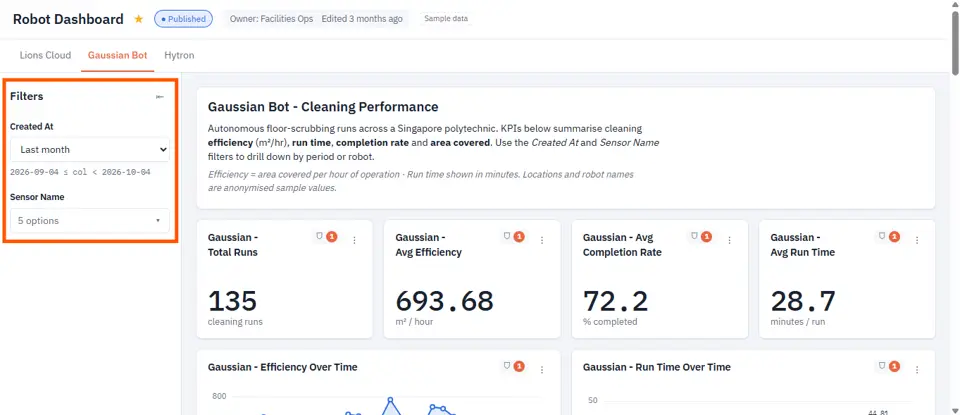
- The KPI cards at the top summarise Gaussian – Total Runs, Gaussian – Avg Efficiency (m² per hour), Gaussian – Avg Completion Rate (%), and Gaussian – Avg Run Time (minutes per run).
- Trend charts such as Gaussian – Efficiency Over Time, Gaussian – Run Time Over Time, and Gaussian Area Cover show how performance changes day by day.
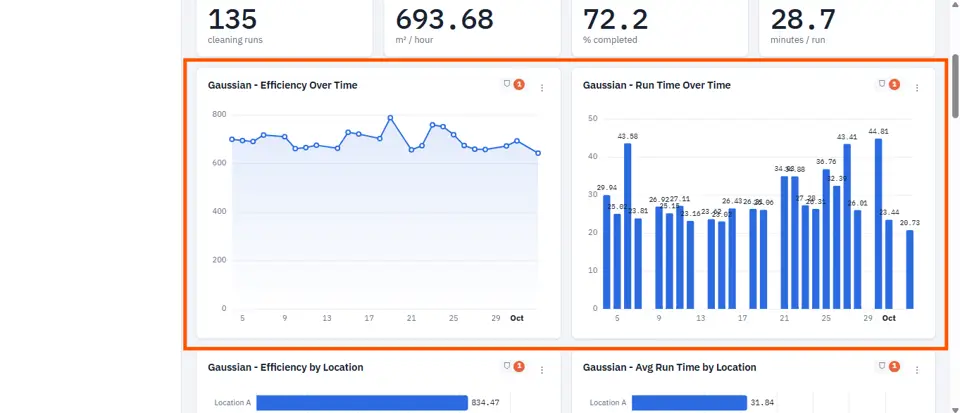
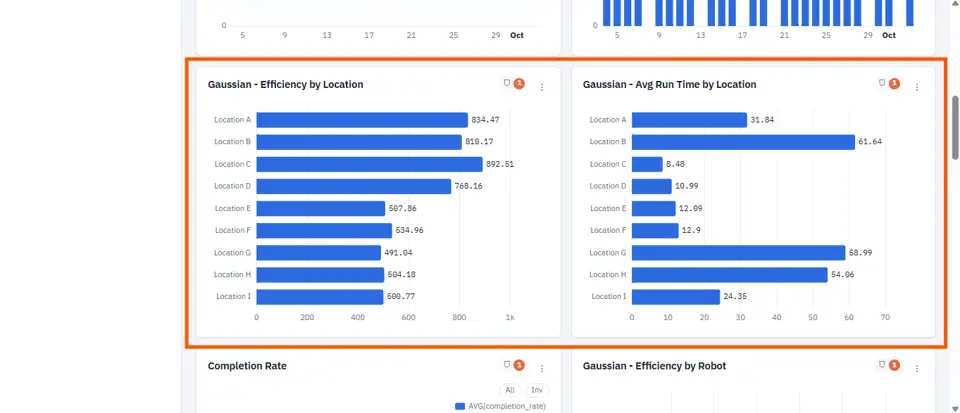
- Location charts such as Gaussian – Efficiency by Location, Gaussian – Avg Run Time by Location, and Area Cover By Location break performance down by the map each robot cleaned.
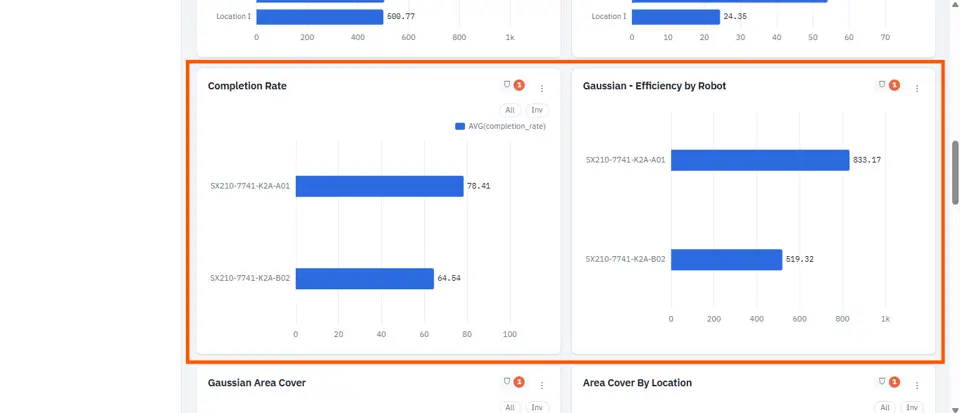
- Robot comparison charts such as Completion Rate, Gaussian – Efficiency by Robot, Gaussian – Runs by Robot, and the Gaussian – Avg Efficiency: Location vs Robot heatmap help you compare robots side by side and spot underperforming robot-location combinations.
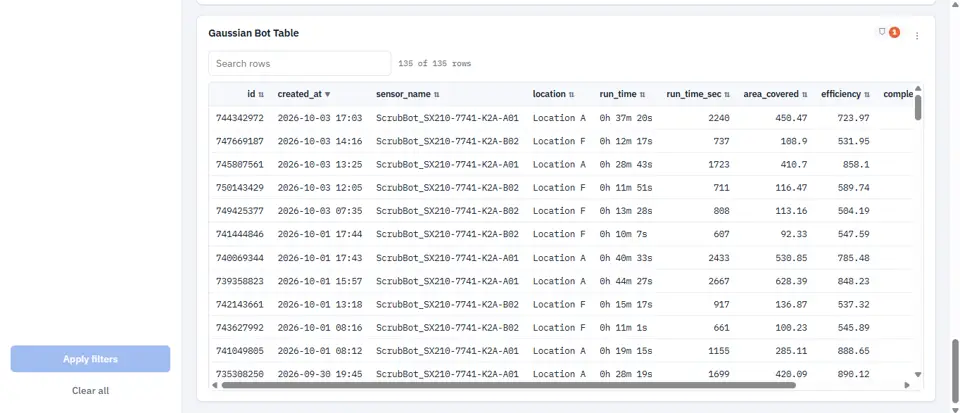
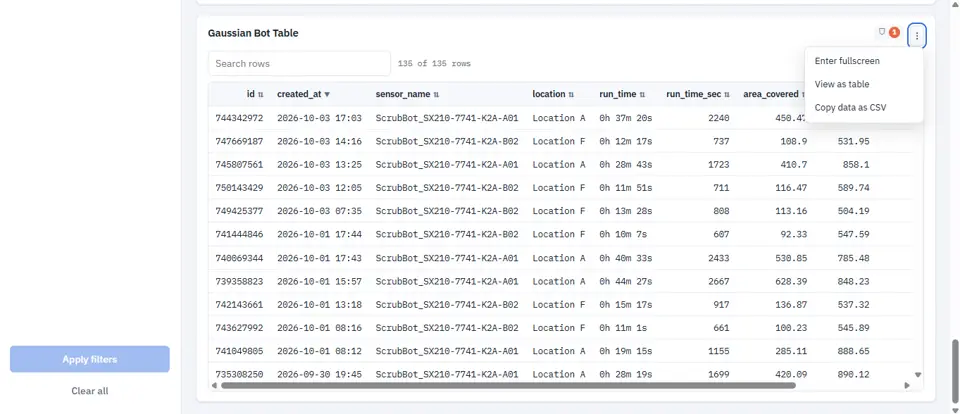
- Scroll to the Gaussian Bot Table at the bottom to see every individual cleaning run, including created_at, sensor_name, location, run_time, area_covered, efficiency, completion_rate, and water_usage.
- Use the Filters panel on the left to narrow the data. Set the Created At range (for example, Last week, Last month, or a custom range) and choose specific Sensor Name values, then click Apply filters to update all charts at once, or Clear all to reset.
- Click the three-dot menu on any chart or table to view it in fullscreen, see the underlying data as a table, or export the data as CSV.
The Gaussian Robot Integration brings Gaussian cleaning robot data directly into FacilityBot through the Sensors integration. By creating one sensor per robot and using its serial number as the MQTT Topic, cleaning data is automatically captured without manual reporting.The data can then be linked to Meters for historical tracking and viewed through the Gaussian Bot dashboard for fleet, robot, and location-level analysis.This helps facility teams monitor cleaning coverage, track efficiency and completion rates, compare robot performance, and identify locations that may require further attention.