
Introduction
FacilityBot now includes standard MTBF (Mean Time Between Failures) and MTTR (Mean Time to Repair) charts on the Asset Data page, giving you a portfolio-wide view of asset reliability instead of having to review downtime records one asset at a time. MTBF and MTTR are calculated from each asset’s downtime records, and an asset needs at least two recorded downtimes before its MTBF becomes available. The MTBF / MTTR tab shows how these metrics trend over time across all your assets, with the option to filter by Asset Type, so you can spot reliability issues and plan preventive maintenance before they become bigger problems.
How It Works
View the MTBF / MTTR Chart
- Log in to the FacilityBot Web Portal.
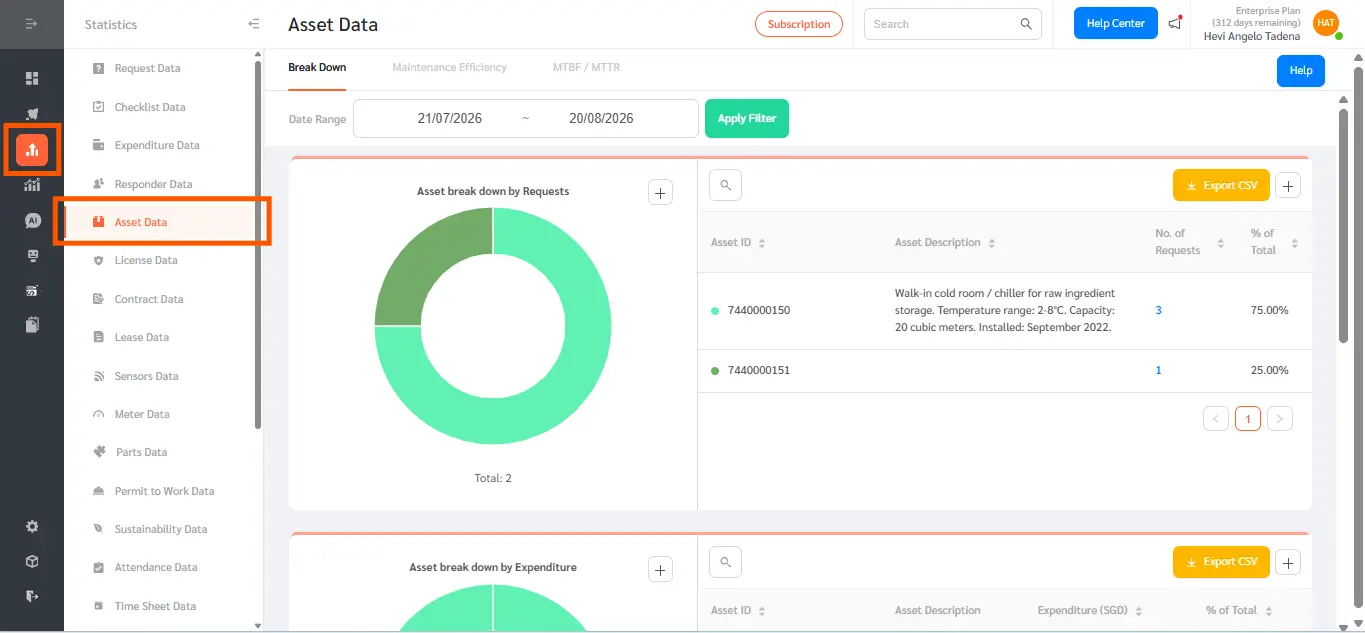
- Navigate to Statistics, then Asset Data.
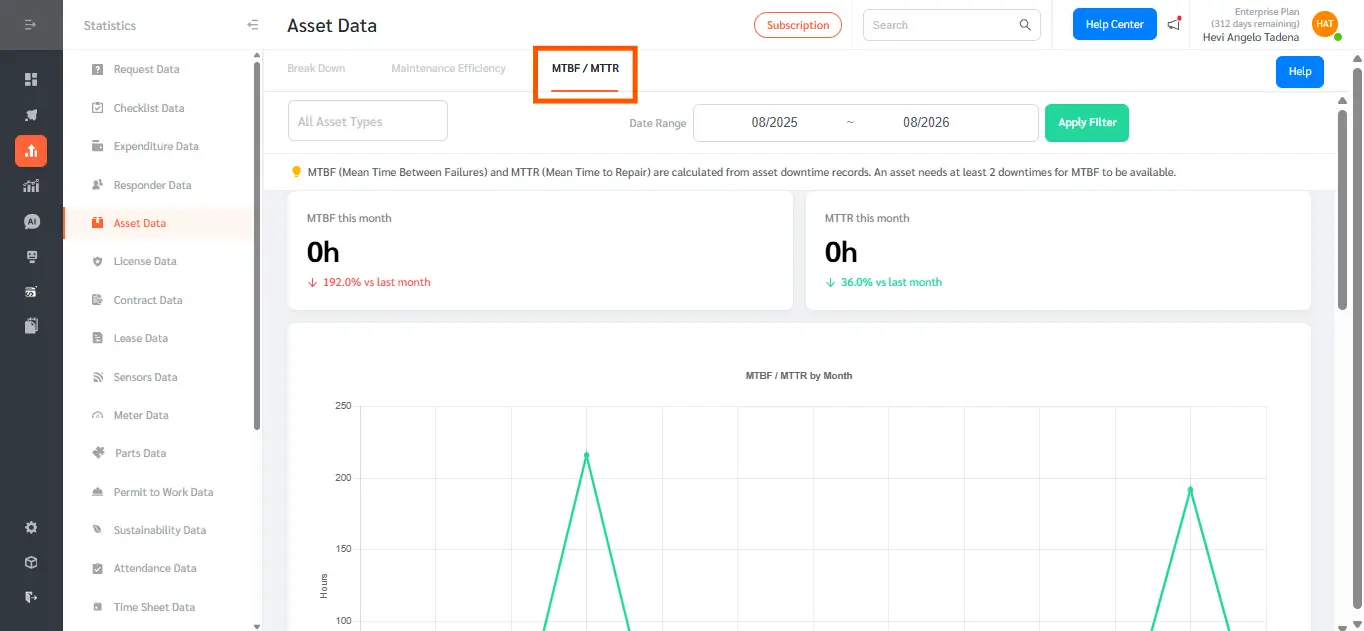
- Select the MTBF / MTTR tab.
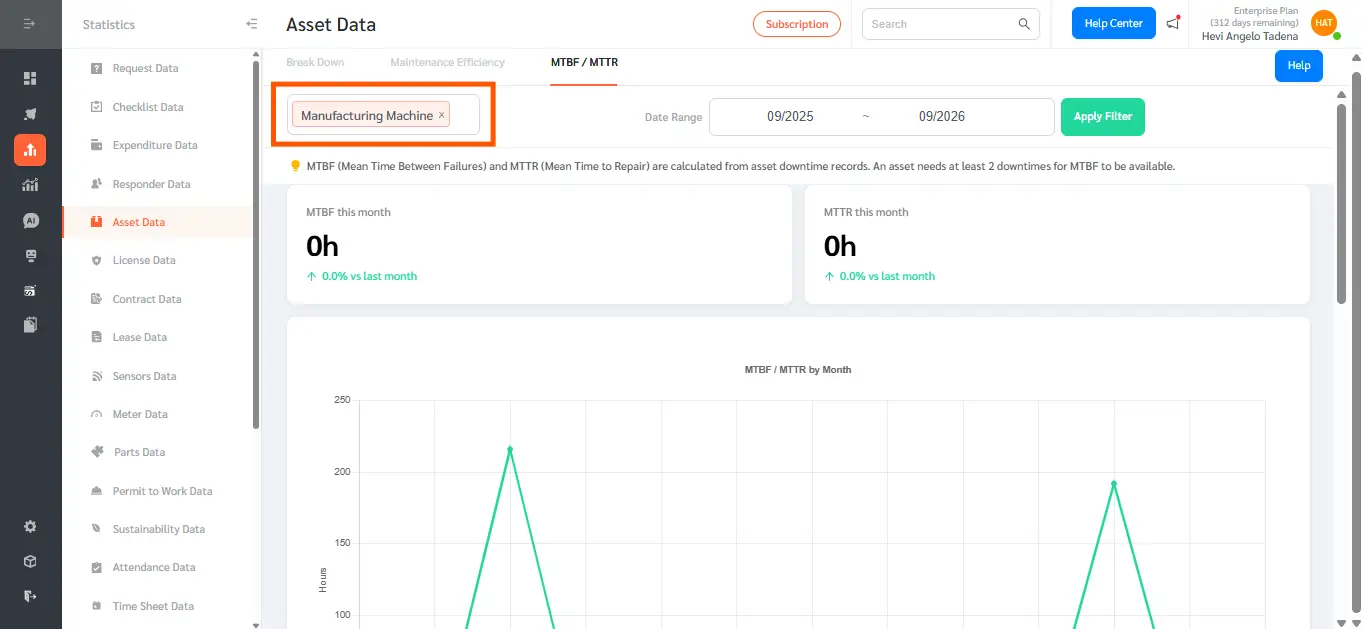
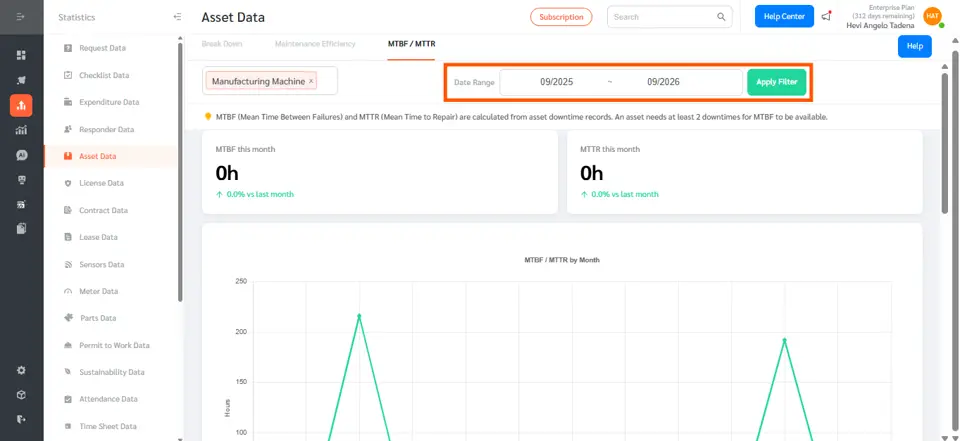
- Use the Asset Types filter to narrow the chart down to one or more specific Asset Types, such as Medical Equipment or Heavy Equipment.
- Set the Date Range you want to analyze, then click Apply Filter.
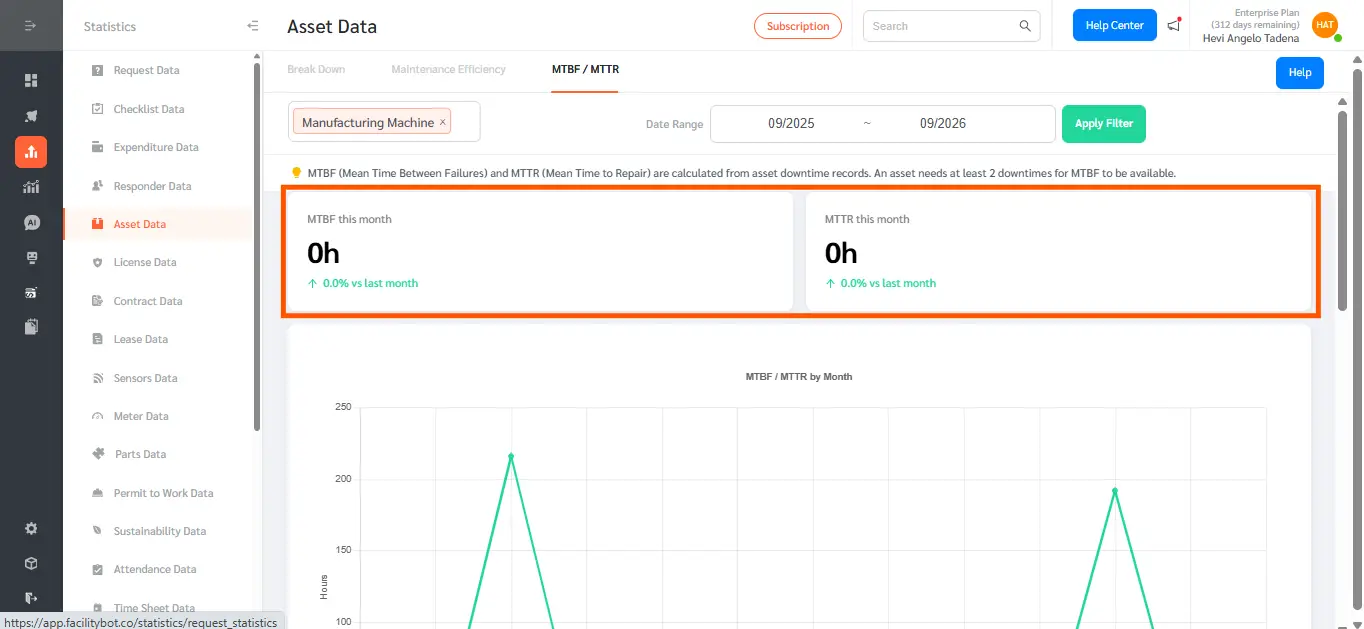
- Review the MTBF this month and MTTR this month summary cards, each showing the percentage change compared to last month.
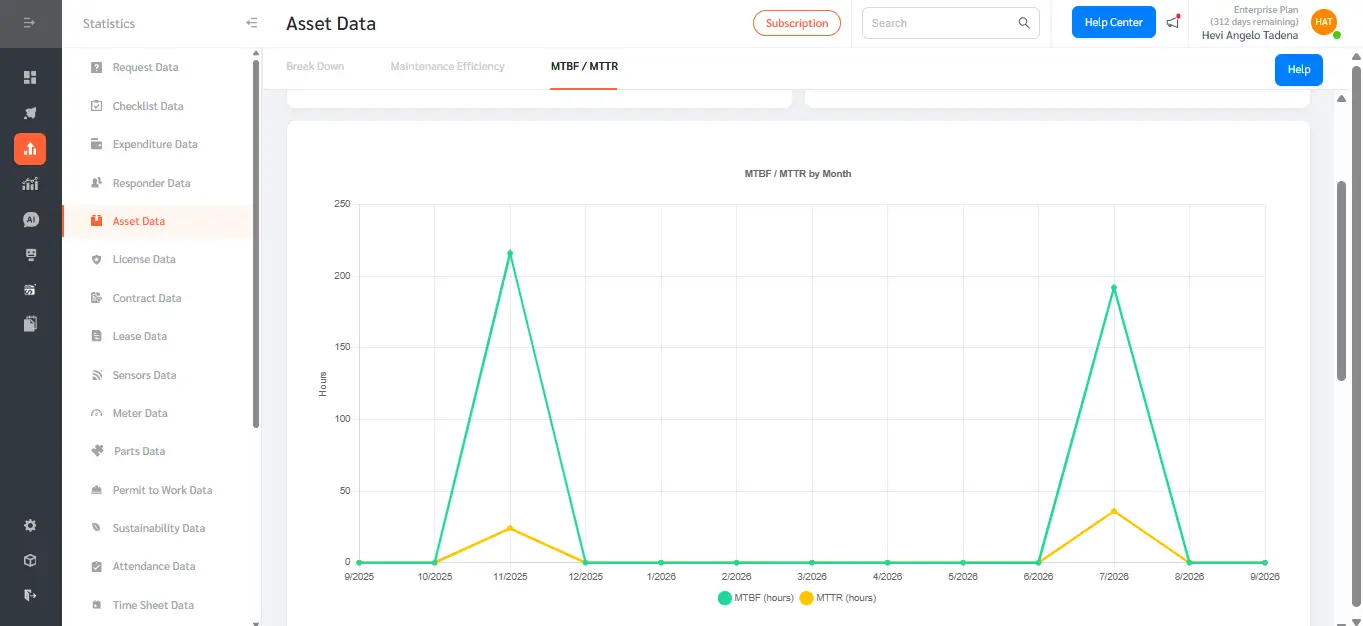
- Review the MTBF / MTTR by Month chart, which plots MTBF (green) and MTTR (yellow) in hours across the selected date range.
Review Asset-Level Detail and Export
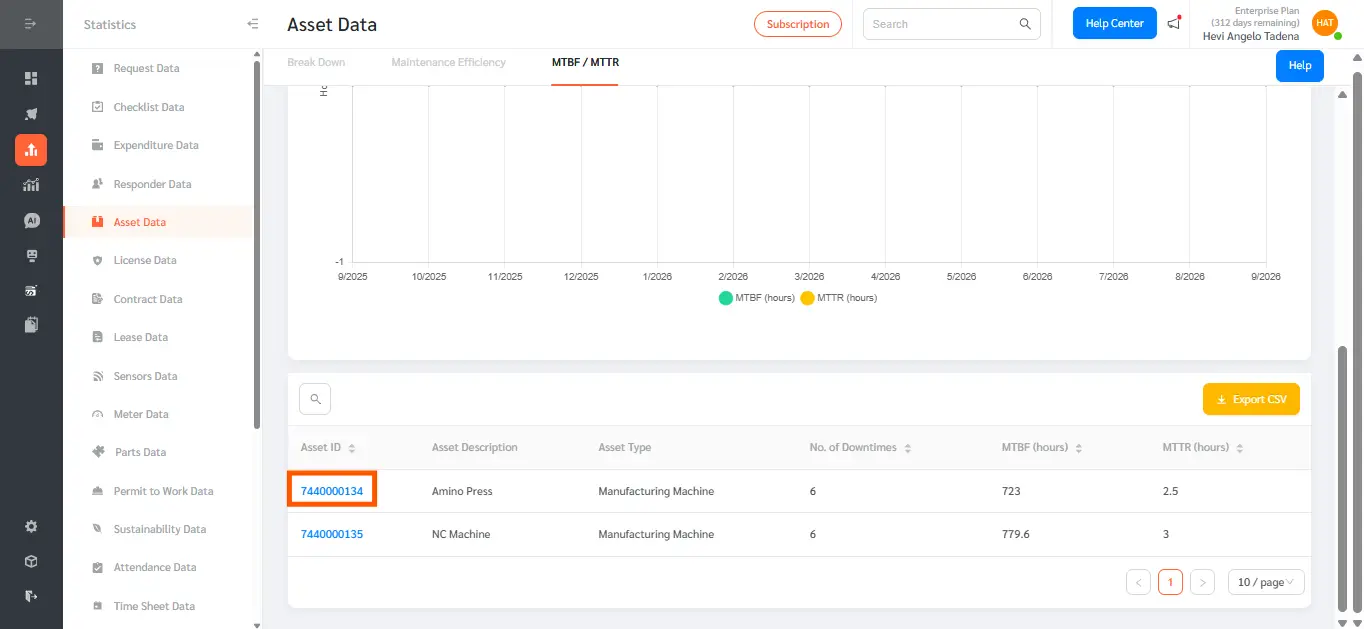
- Scroll down to the asset-level table below the chart, which lists every asset with its Asset Type, No. of Downtimes, MTBF (hours), and MTTR (hours).
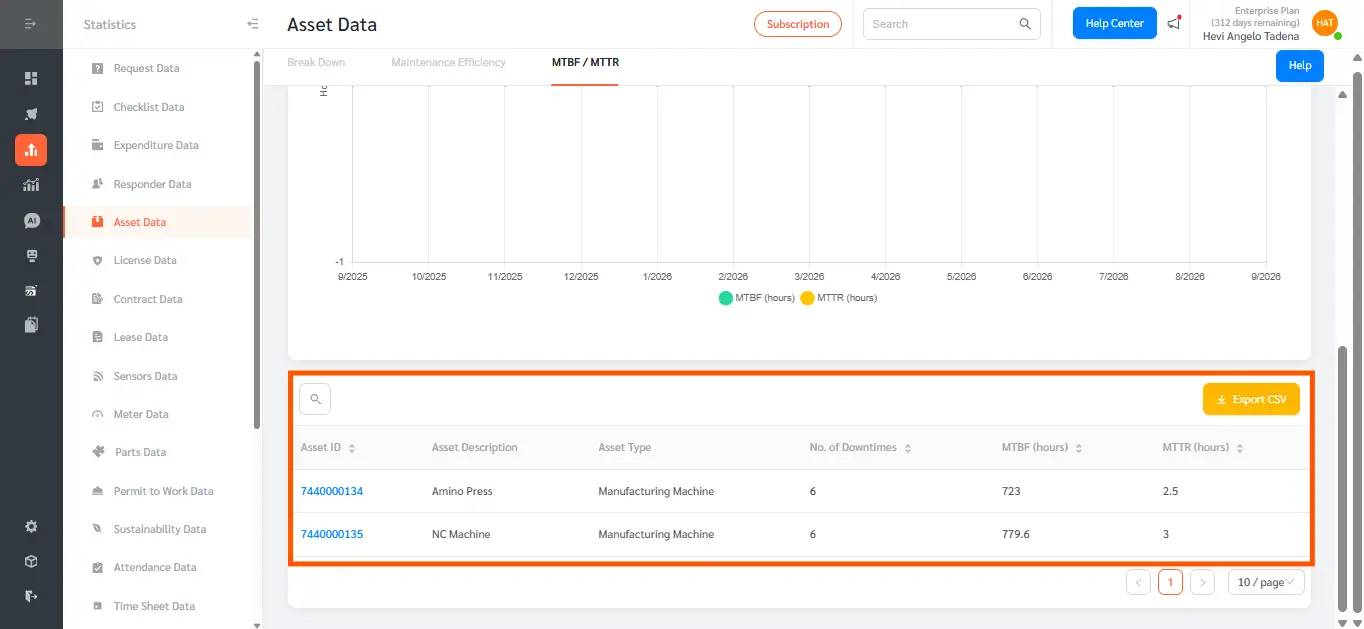
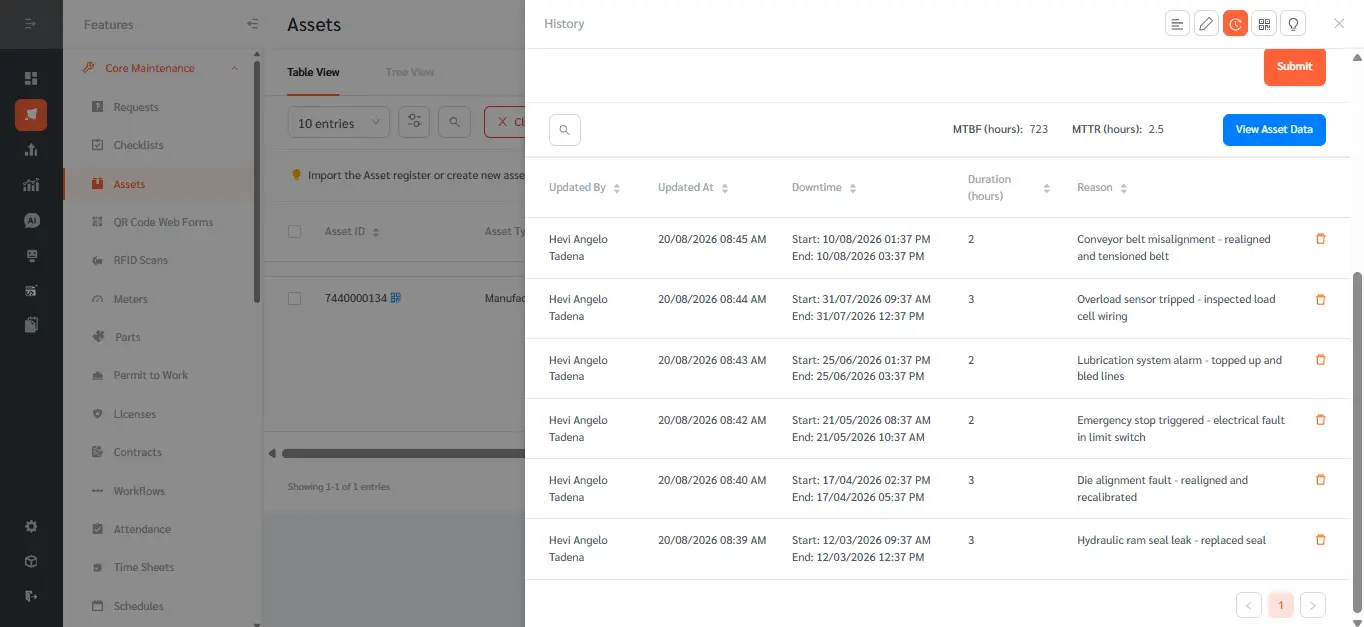
- Click an Asset ID in the table to open that asset’s own record and review its individual downtime history.
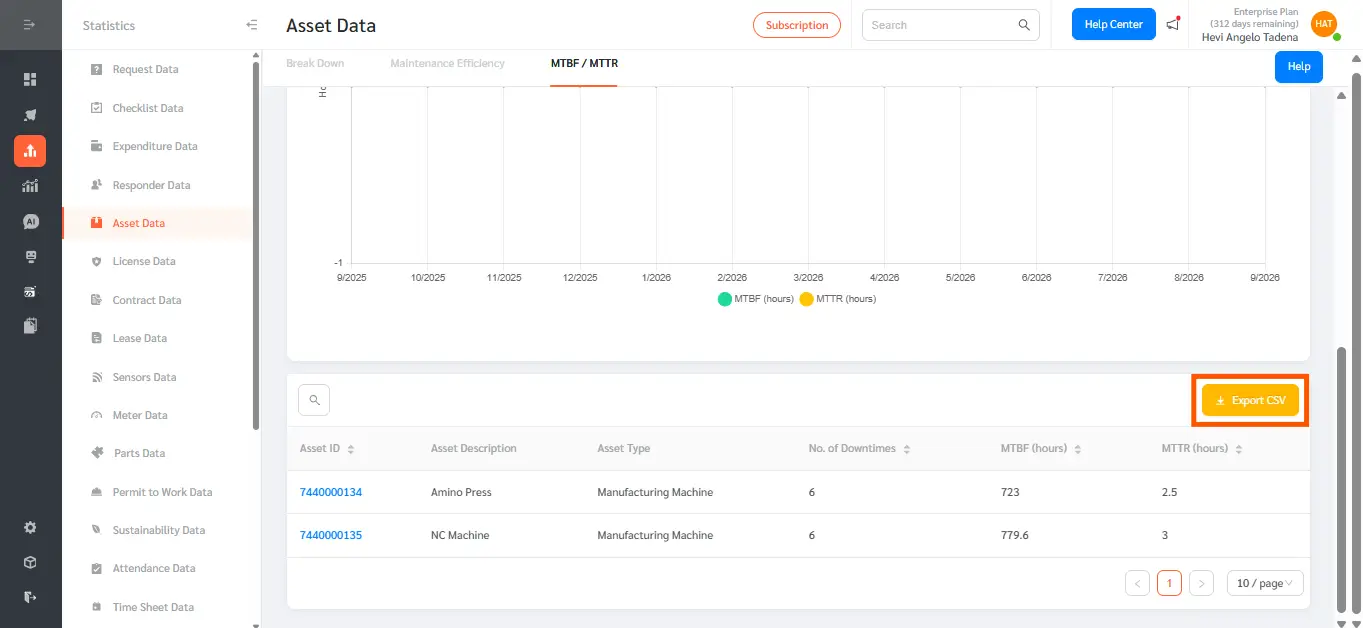
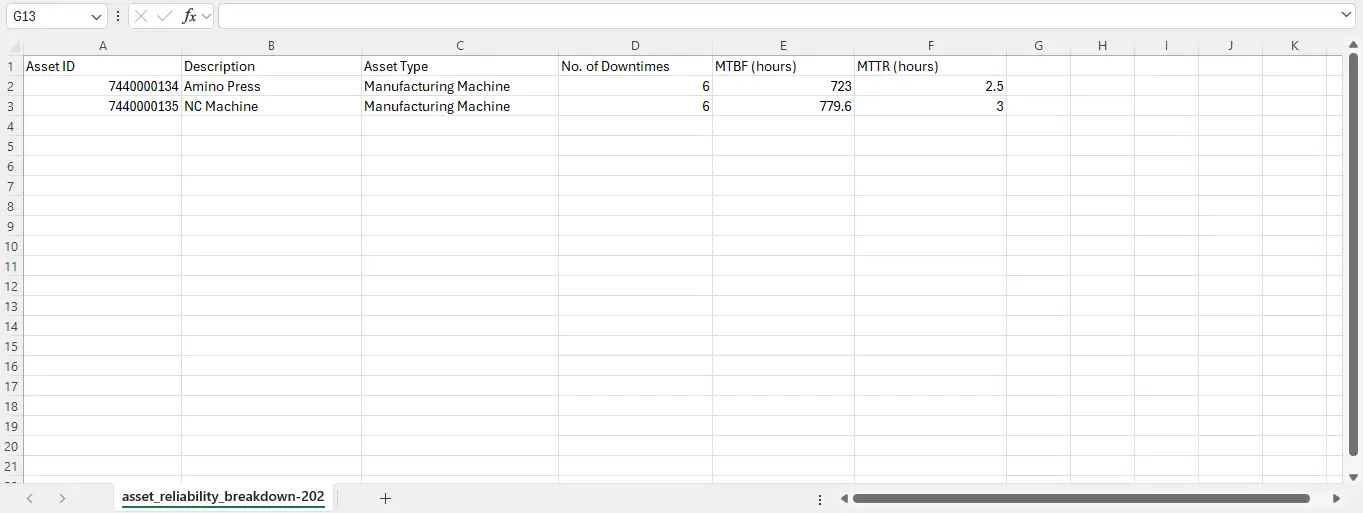
- Click Export CSV to download the asset-level MTBF / MTTR data for reporting or further analysis.
The MTBF / MTTR Charts give facility and reliability teams a fast way to see how assets are performing across an entire portfolio, not just one at a time. By tracking Mean Time Between Failures and Mean Time to Repair trends by month, and letting you filter by Asset Type, FacilityBot makes it easier to spot assets or asset categories that are failing more often or taking longer to fix, benchmark reliability across sites or asset classes, and justify preventive maintenance or replacement decisions with data. Common use cases include monthly reliability reviews, prioritizing preventive maintenance budgets toward the asset types with the weakest MTBF, and exporting the underlying data for board or client reporting.