Introduction
FacilityBot now supports a direct integration with LionsBot cleaning robots through the LionsBot Cloud API. Once configured, FacilityBot automatically polls each paired robot at a defined interval and stores its operational data — such as cleaning completion percentage, area covered, run time, status, and landmarks — as sensor readings. These readings can then be linked to Meters for trending and dashboards, and used in Workflows and Reports, giving facility managers a single pane of glass over their robotic cleaning fleet alongside the rest of their FacilityBot operations.
How It Works
Configure LionsBot Credentials
- Log in to the FacilityBot Web Portal.
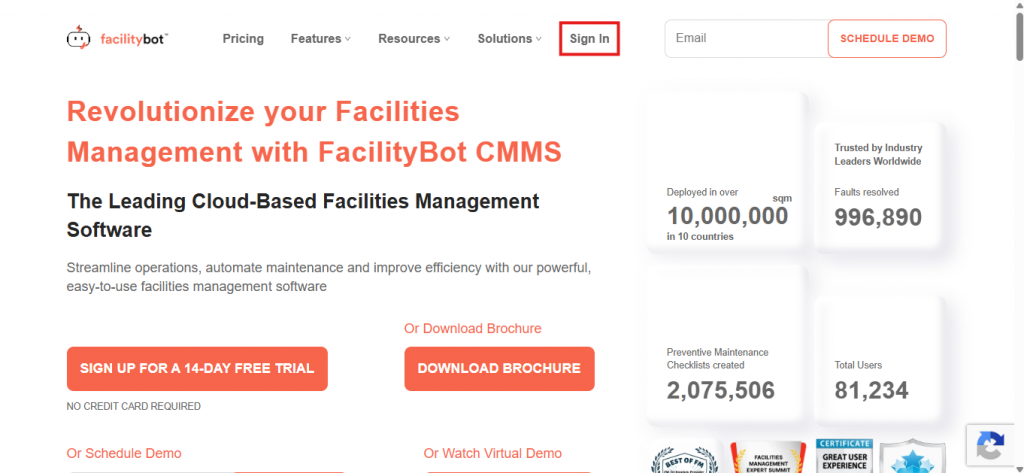
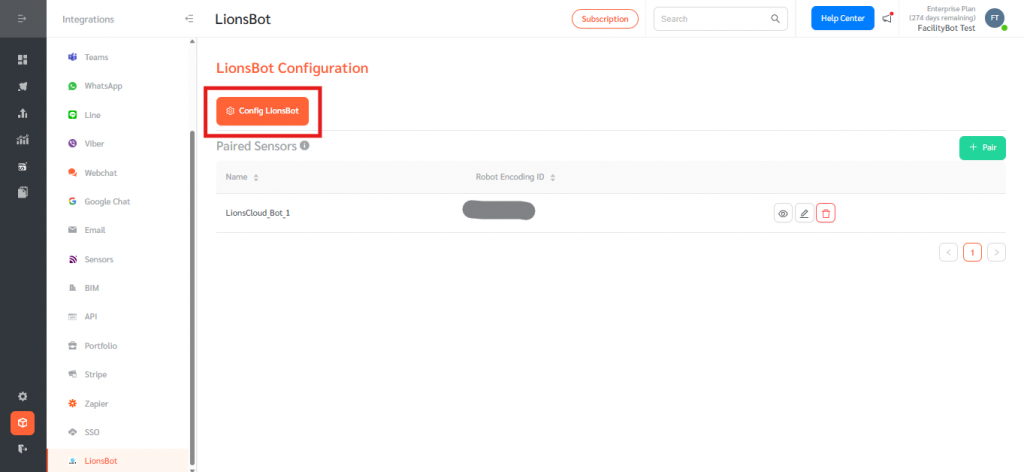
- In the left navigation, click Integrations, then LionsBot.
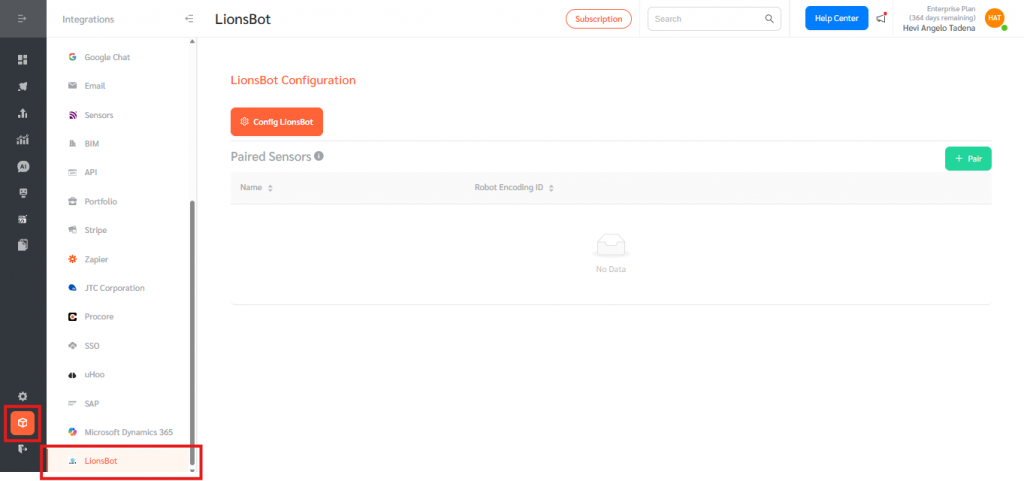
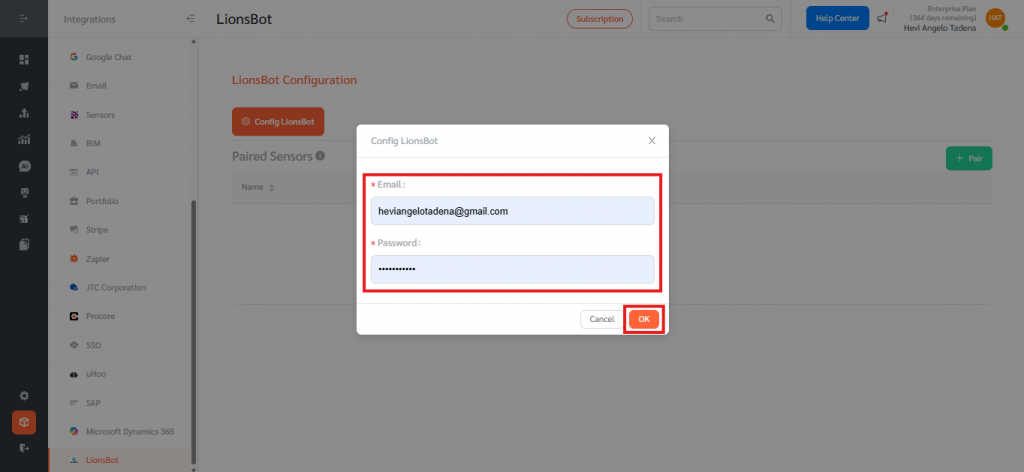
- On the LionsBot Configuration page, click the orange Config LionsBot button.
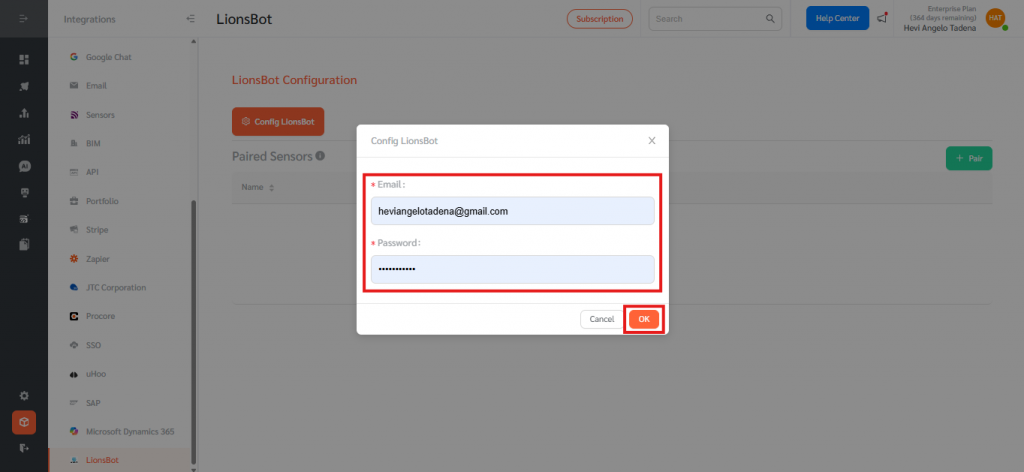
- In the Config LionsBot dialog, enter the Email and Password of your LionsBot Developer Portal account (https://developer.lionsbot.cloud). These credentials authorise FacilityBot to call the LionsBot Cloud API on your behalf. Click OK to save the credentials.
Pair a Robot to a Sensor
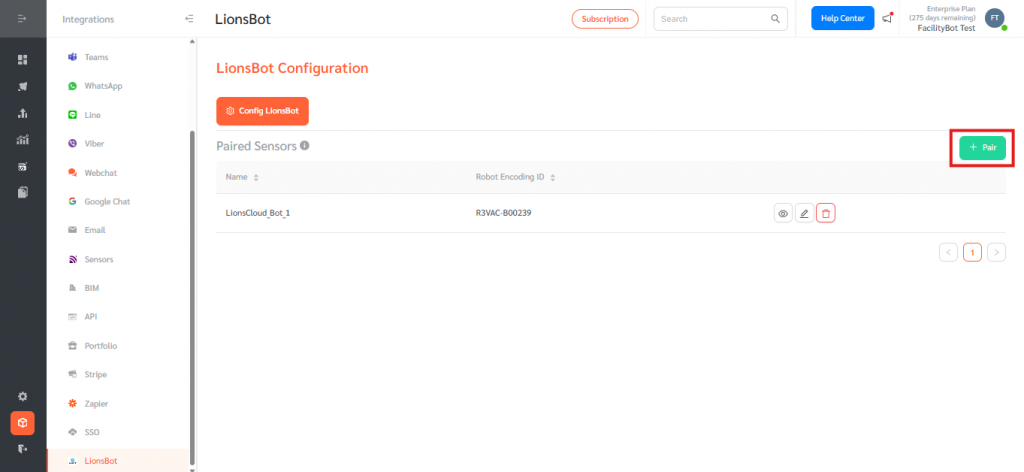
- On the LionsBot Configuration page, locate the Paired Sensors section and click + Pair at the top right.
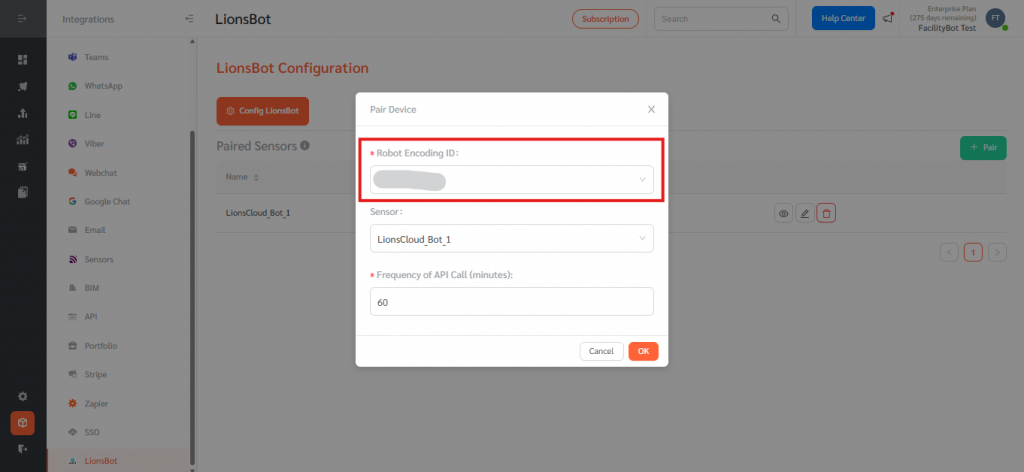
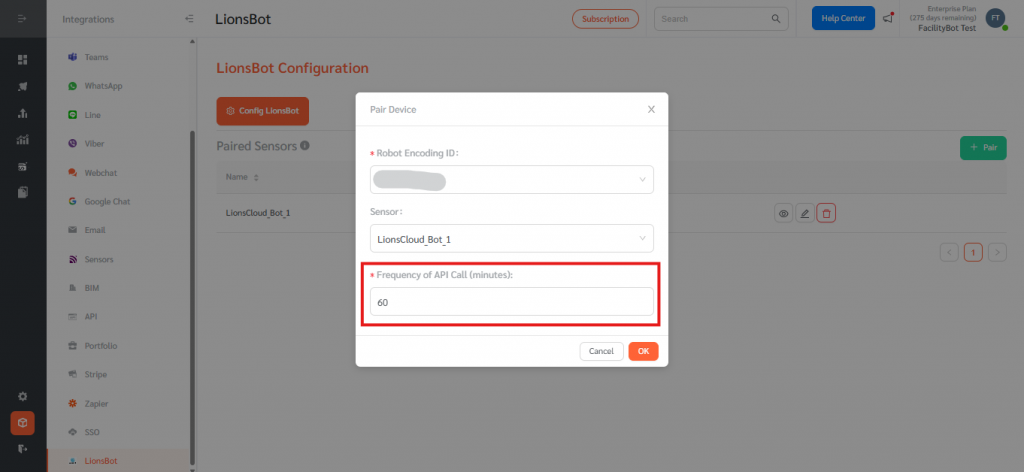
- In the Pair Device dialog, enter the Robot Encoding ID. This is the unique identifier of the robot in the LionsBot Developer Portal.
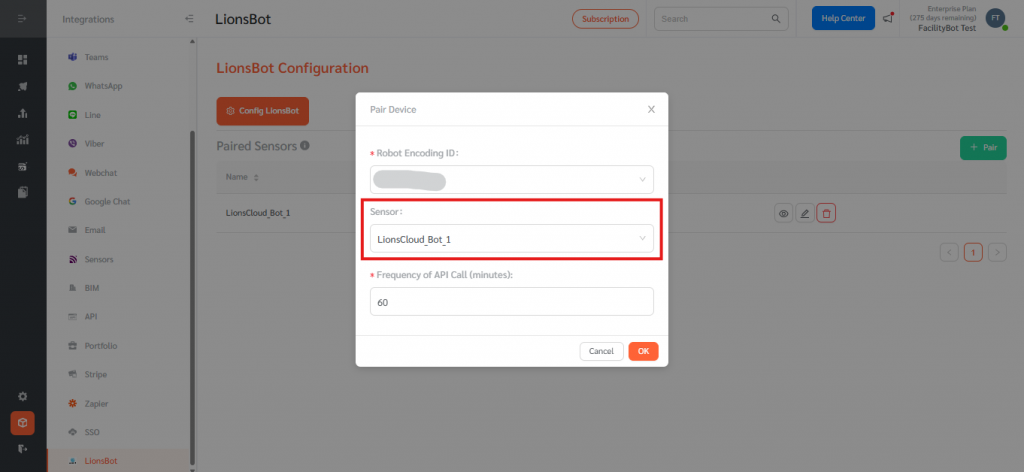
- Select the Sensor in FacilityBot that should receive the robot’s data. Sensors are created in Integrations > Sensors and can include parameters such as percent, duration and status, for the typical robot data points.
- Set the Frequency of API Call (minutes), which controls how often FacilityBot polls LionsBot for new data. The default is 60 minutes.
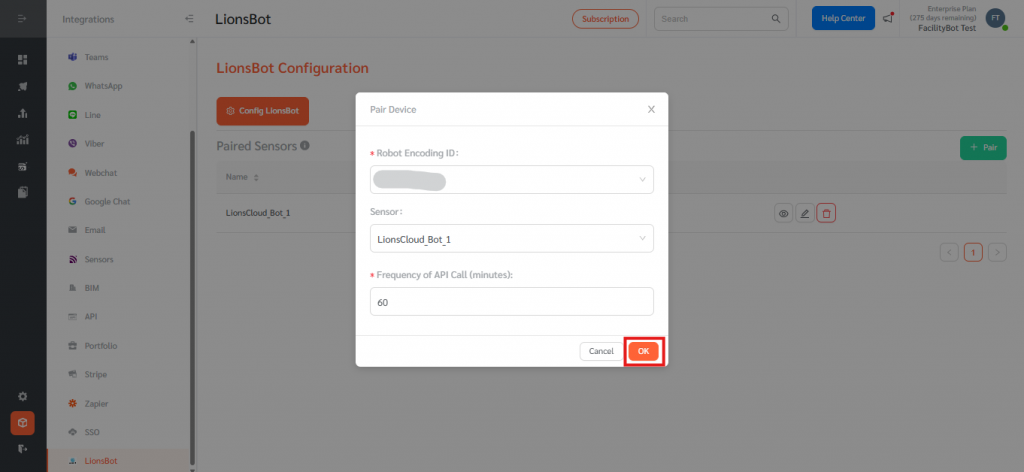
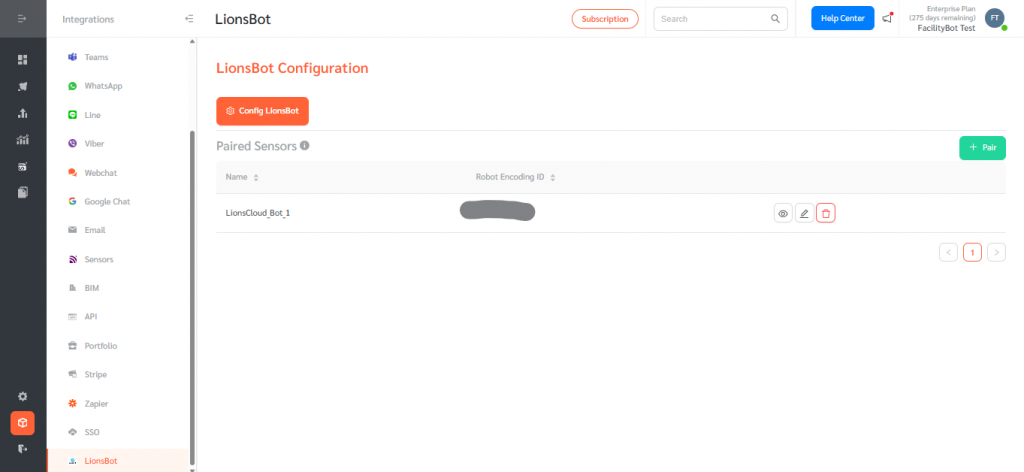
- Click OK. The paired robot now appears in the Paired Sensors list, showing its Name and Robot Encoding ID.
Link Robot Data to Meters
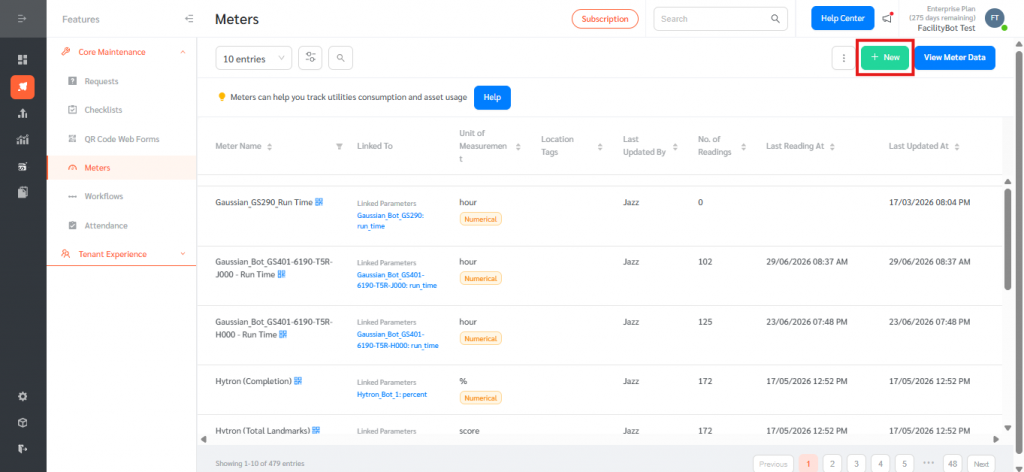
- Go to Features, then Meters.
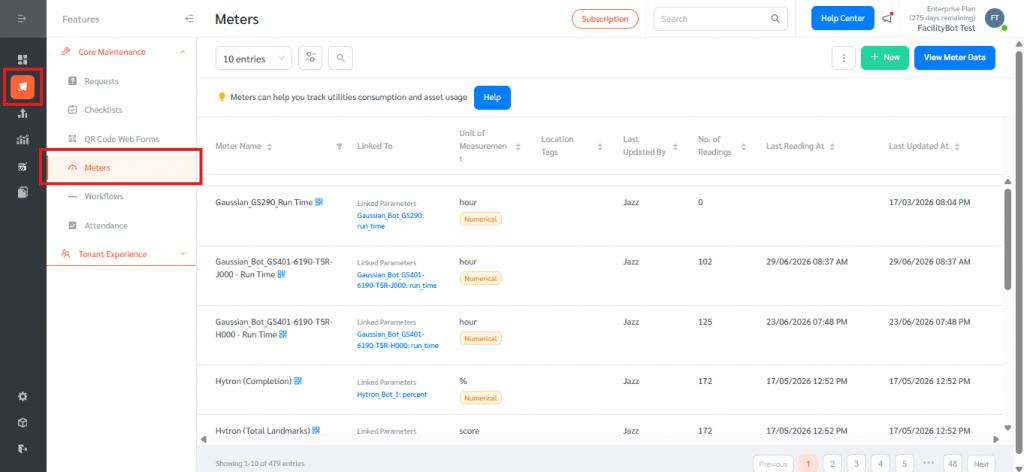
- Click + New to create a meter for a specific robot data point, such as cleaning completion percentage.
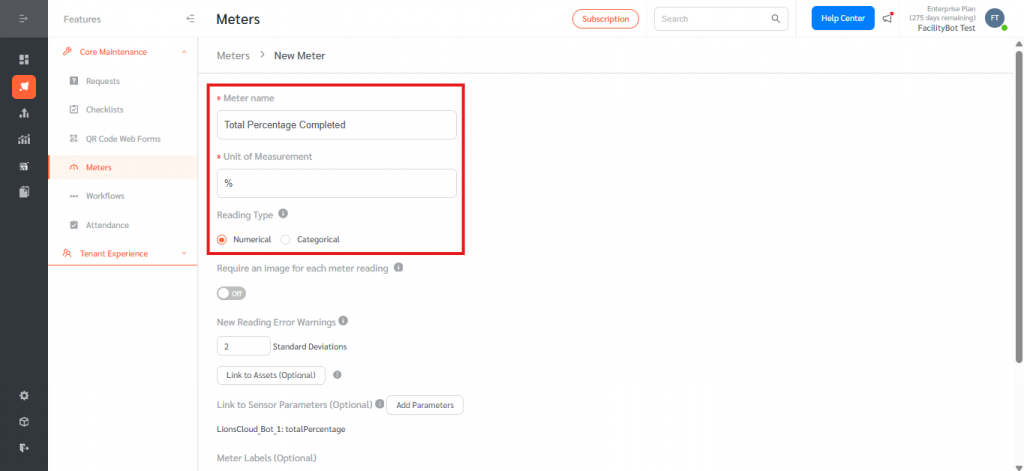
- Enter the Meter Name, Unit of Measurement, and Reading Type. For percentage values use Numerical with unit “%”; for status, use Categorical.
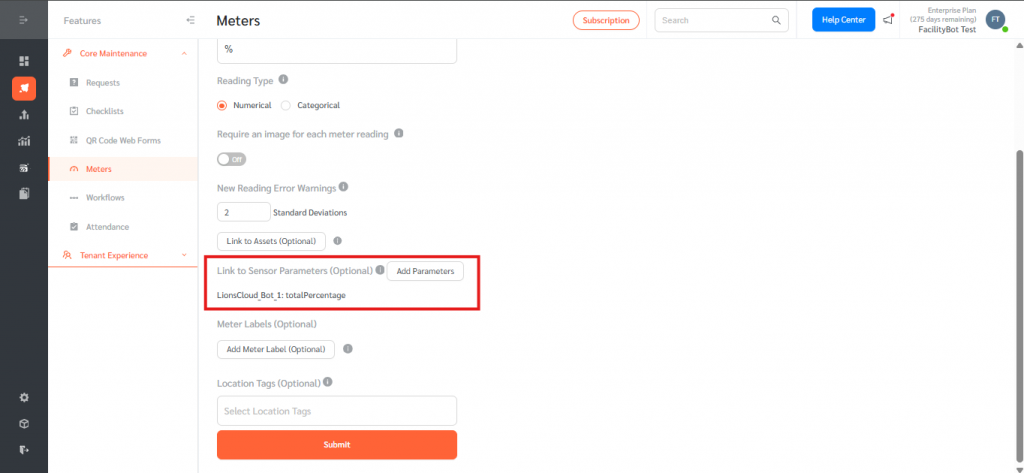
- In Link to Sensor Parameters, click Add Parameters and select the paired robot’s sensor and the specific parameter — for example, LionsCloud_Bot_1: totalPercentage.
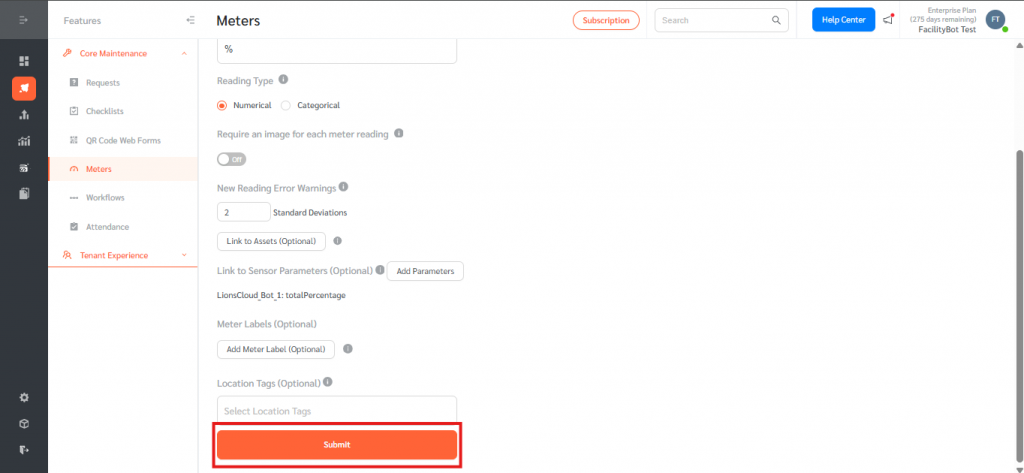
- Click Submit. The meter will automatically populate with new readings each time FacilityBot polls the robot.
View Robot Data and Manage Pairings
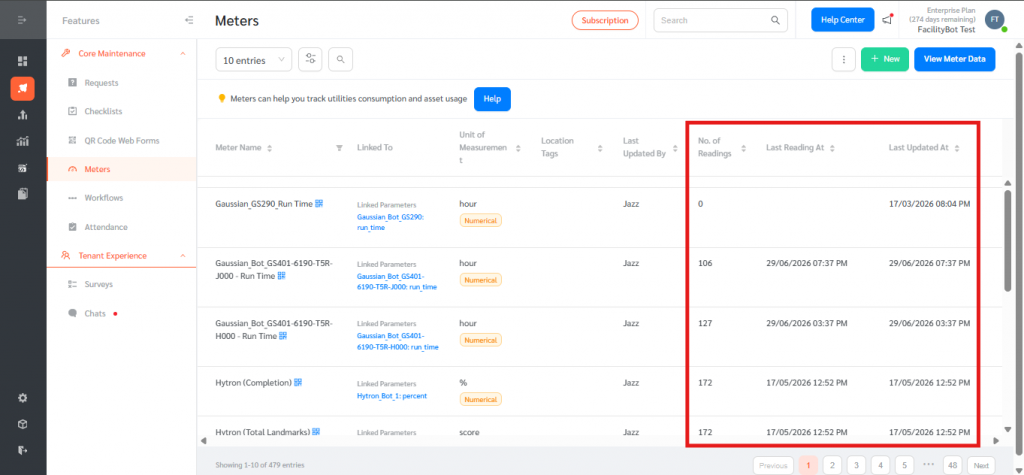
- On the Meters page, each robot meter displays Last Reading At, Last Updated At, and the number of readings collected.
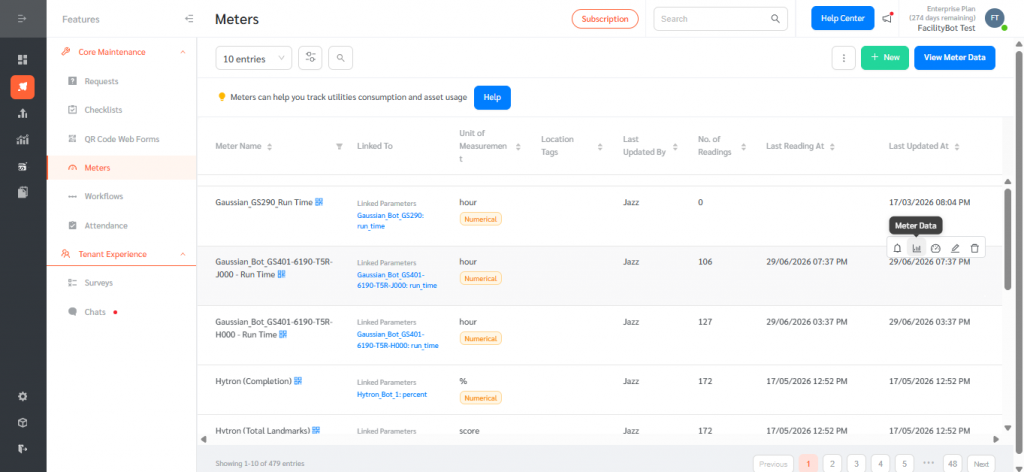
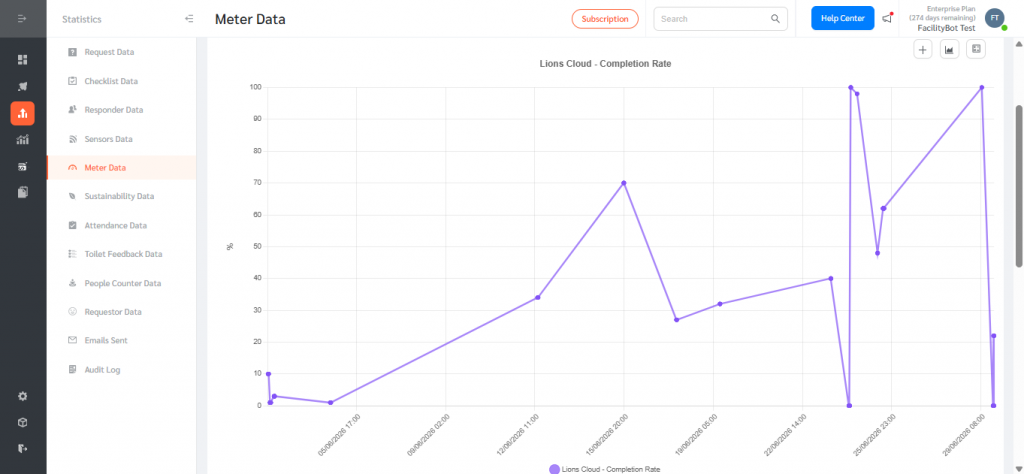
- Click View Meter Data Icon to see the historical readings as a chart or table for trending and analysis.
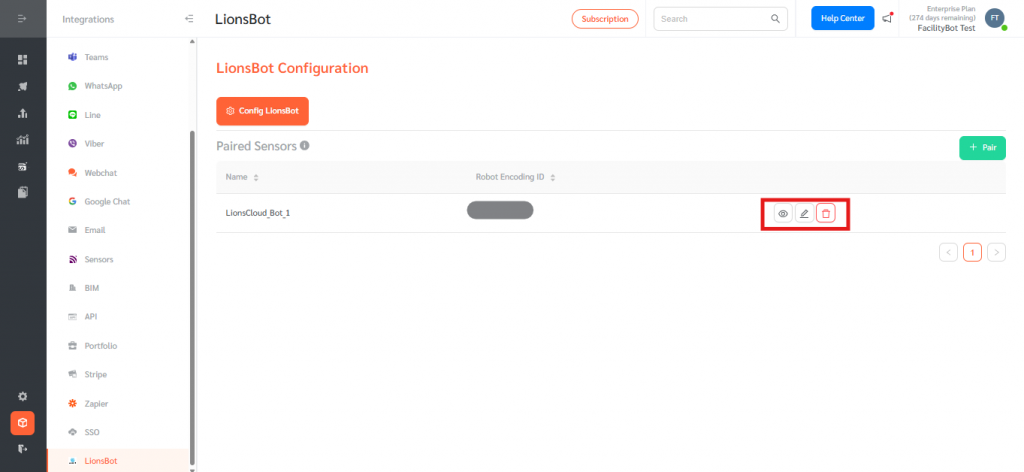
- To update or remove a paired robot, return to Integrations > LionsBot. Use the view, edit, or delete icons on each row in the Paired Sensors list.
- To rotate credentials, click Config LionsBot again and update the Email or Password.
View Robot Performance in the Analytics Dashboard
FacilityBot’s Analytics module turns the sensor and meter data collected from each paired robot into interactive dashboards. A dashboard combines multiple charts and tables on a single page, with built-in filters so you can quickly drill down by time range, sensor, or robot brand. Use it to monitor day-to-day cleaning performance, compare robot fleets across sites, spot anomalies in completion rates or runtime, and share a consolidated operational view with your team.
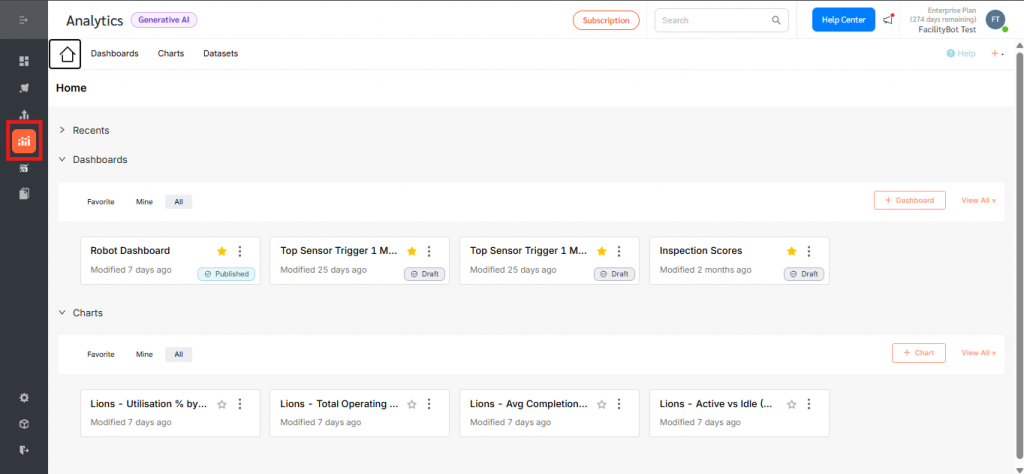
- In the left navigation, click Analytics. The Home view shows your Recents, Dashboards, and Charts.
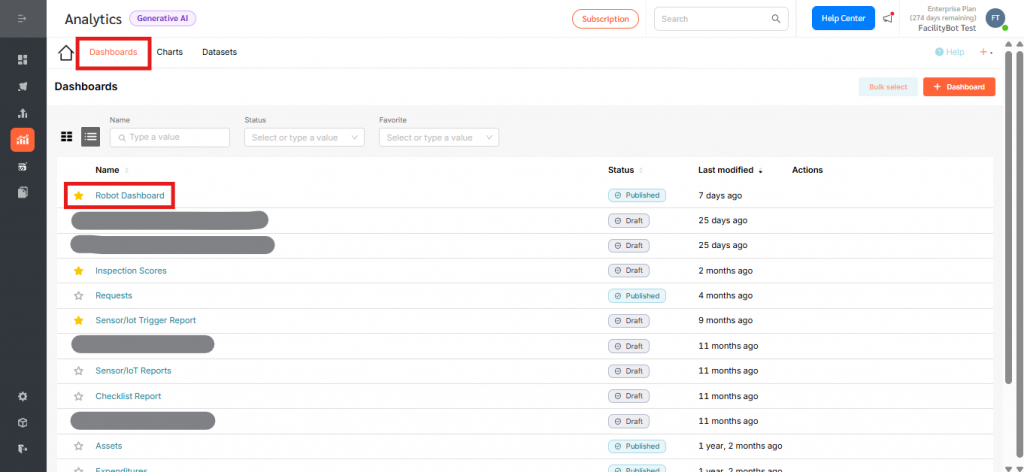
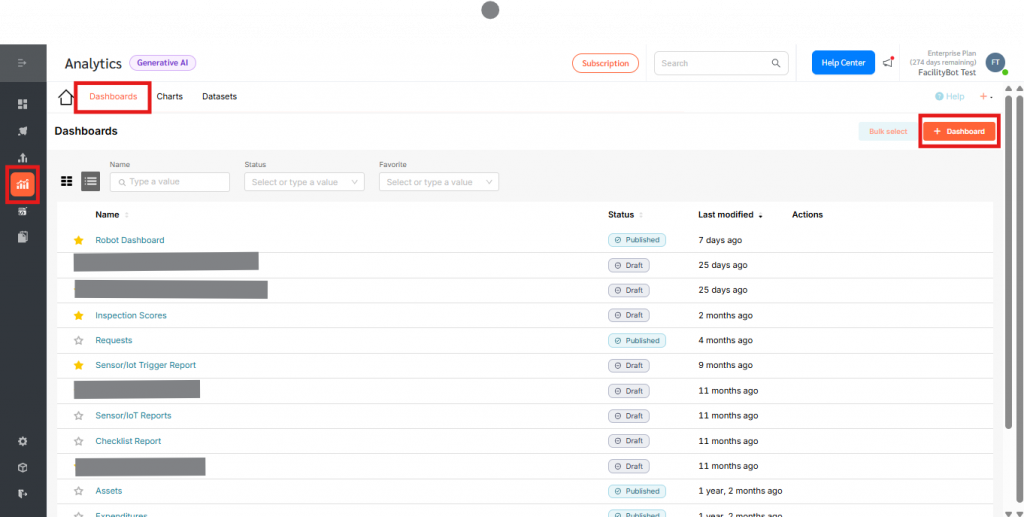
- Click the Dashboards tab to see all available dashboards. To open the pre-built robot view, click Robot Dashboard.
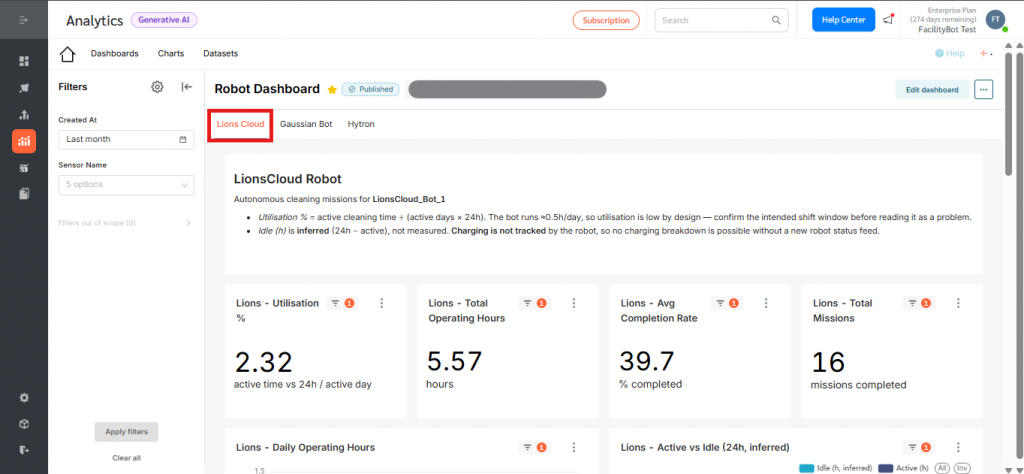
- The Robot Dashboard is organised into tabs for each supported brand — Lions Cloud, Gaussian Bot, and Hytron. Click a tab to switch between robot fleets.
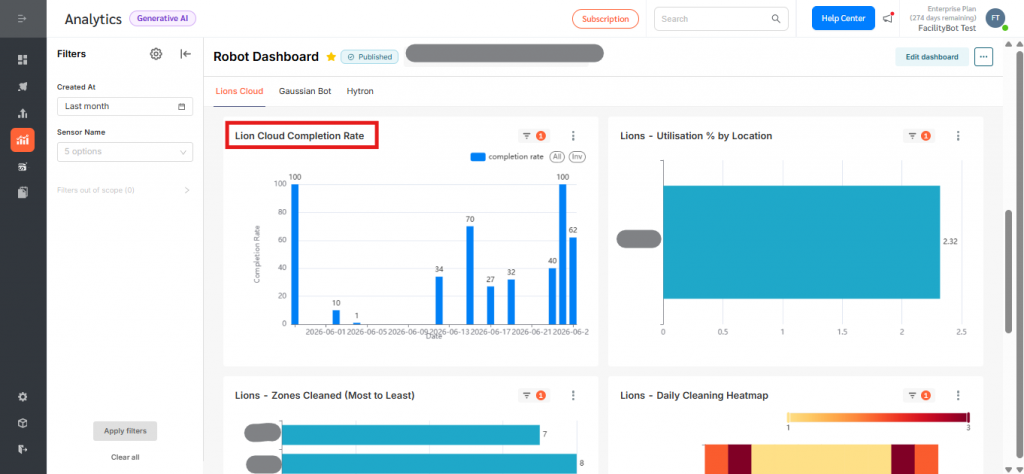
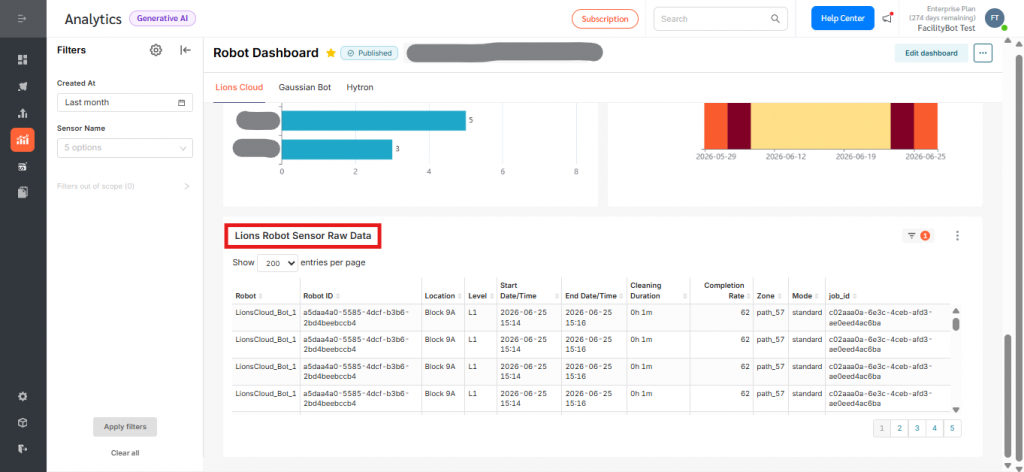
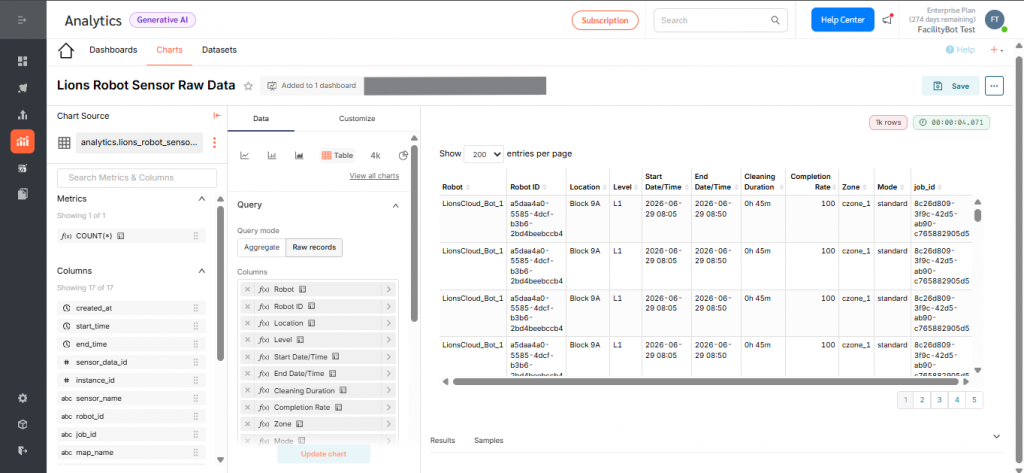
- Each tab includes charts such as Lion Cloud Completion Rate (%) for trend visualisation and tables such as Lions Robot Sensor Raw Data for granular drill-down into individual readings.
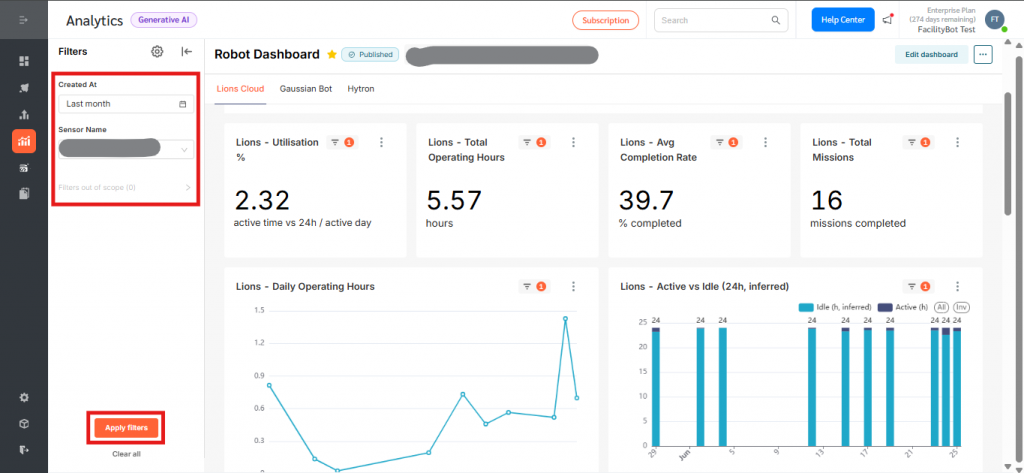
- Use the Filters panel on the left to narrow the data. Set the Created At range (for example, Last year, Last 30 days, or custom dates) and choose specific Sensor Name values. Click Apply filters to update all charts at once, or Clear all to reset.
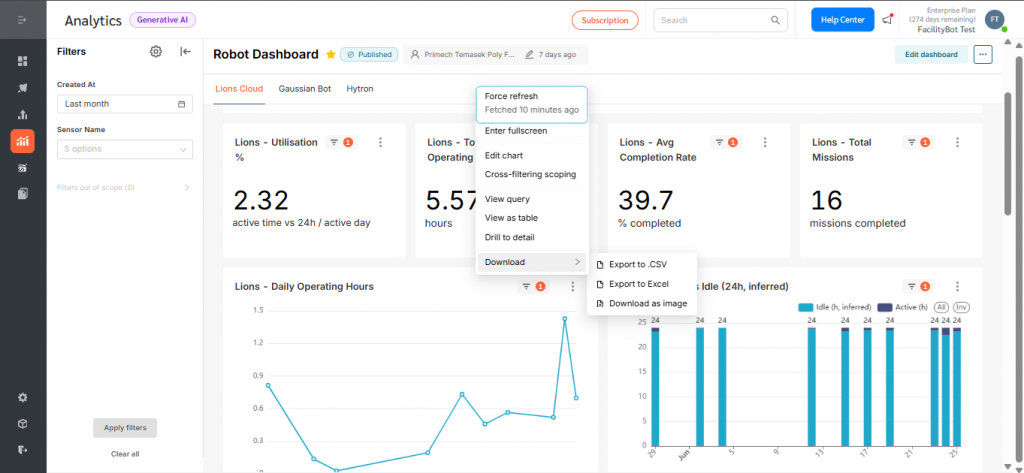
- Hover over a chart or table title and click the three-dot menu to refresh data, view the underlying chart definition, or download the data as CSV.
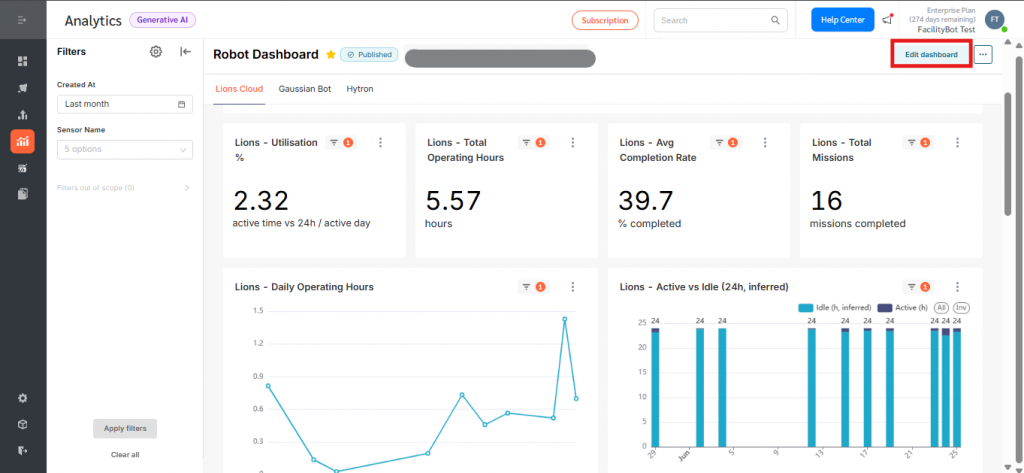
- To customise the dashboard, click Edit dashboard at the top right. You can rearrange charts, add new ones, change the layout, and adjust filters. Click Save when done.
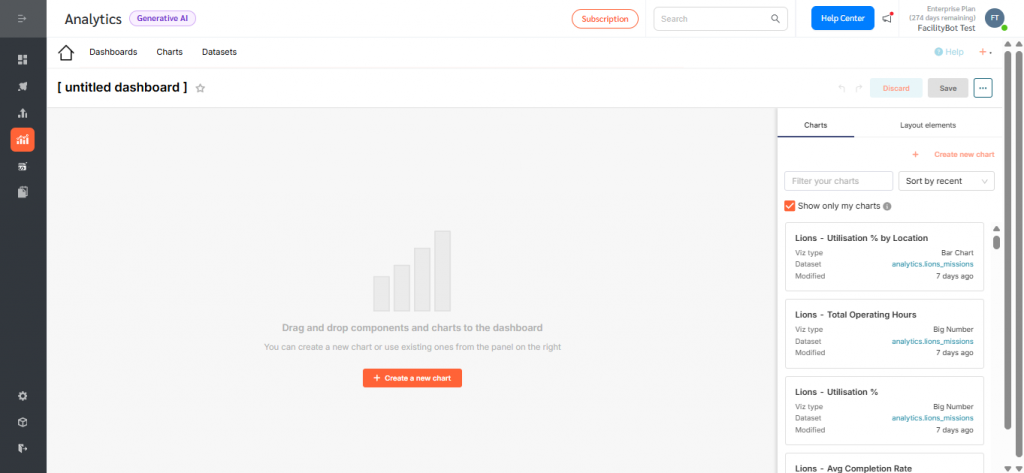
- To create a new dashboard from scratch, return to Analytics > Dashboards and click + Dashboard at the top right. Add charts based on your robot meters or sensor datasets, then publish when ready.
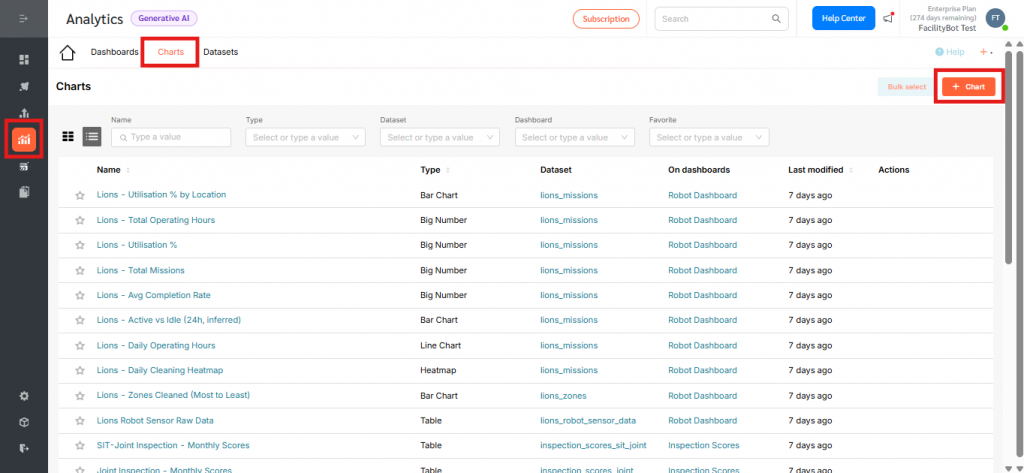
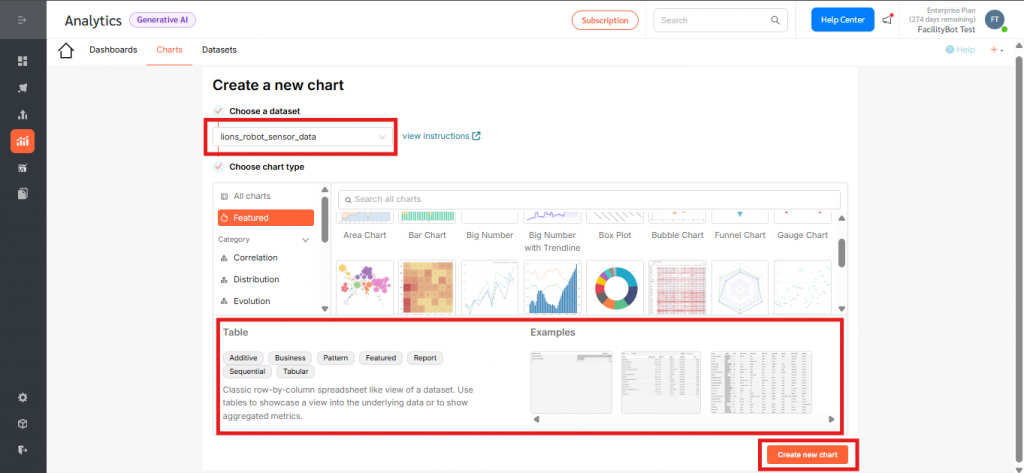
- To create a standalone chart (for example, a single metric for a wall display), go to the Charts tab, click + Chart, choose the robot dataset, select a visualization type, and save.
The LionsBot Robot Integration brings autonomous cleaning robots into the same FacilityBot workspace already used for requests, checklists, sensors, and meters. By configuring LionsBot Developer Portal credentials once and pairing each robot to a sensor, facility managers can automatically capture operational metrics such as cleaning completion, area covered, status, and landmarks without manual reporting. Paired with the Analytics dashboard, the integration also gives operations teams a real-time, filterable view of fleet performance across brands and sites. Common use cases include monitoring daily cleaning performance across multiple sites, triggering follow-up requests when a robot’s status indicates an issue, and benchmarking productivity of robotic versus manual cleaning. Overall, the LionsBot integration extends FacilityBot’s visibility into robotic operations, enabling smarter, data-driven facility management.